
Traders often face situations where price movements defy logic, leading to confusion and losses. One of the most deceptive patterns in trading is the bearish fakeout. This setup is a favourite tool of smart money and institutions, allowing them to profit from the mistakes of the majority. The bearish fakeout, once fully understood, can transform your approach to trading. It shifts you from chasing breakouts to patiently waiting for opportunities where others get trapped.
In this comprehensive guide, we will explore what a bearish fakeout is, why it happens, how to spot it, and the exact strategy you can use to capitalise on this powerful pattern. We will also look at real examples, market psychology, and advanced applications to help you master this profitable approach.
What is a bearish fakeout?
The bearish fakeout is a price action event that occurs when the market pushes above a well-known resistance level, creating the illusion of a breakout. Most traders, driven by the hope of catching a new trend, enter buy positions. For a moment, the price appears strong. However, almost immediately, the momentum fades and the price crashes back below resistance. This sudden reversal triggers panic selling and results in a rapid drop, trapping the breakout traders in losing trades. Those who recognise the setup and patiently wait for confirmation can enter short positions with an excellent risk-reward profile.
The bearish fakeout is sometimes called a bull trap. This is because the move tricks buyers into entering long trades just before a reversal. The core principle is that the breakout is false. Instead of the price moving into a new bullish phase, it quickly snaps back and often accelerates downward. This pattern is common in range-bound markets where price oscillates between established support and resistance levels. The false breakout pattern repeatedly entices traders to bet on trend continuation, only to reverse with force.
Real-World Example: Bearish Fakeout in Action
Consider a scenario in the EURUSD forex pair. The market has established a resistance zone around 1.1000. Price tests this level several times, failing to break higher. Suddenly, a strong bullish candle pierces 1.1000 and closes above it. Excited traders rush to buy, convinced a breakout is underway. But instead of continuing up, the next few candles show indecision. Within a short time, the price collapses back below 1.1000 and falls towards 1.0950. Traders who bought the breakout are now underwater. Those who waited for the reversal recognise the bearish fakeout and profit from the move down.
This pattern is not limited to currency markets. You can see bearish fakeouts in stocks, commodities, and crypto. In all markets, the underlying principle is the same: a failed breakout above resistance creates a trading range reversal and a prime opportunity to go short.

Why Do Bearish Fakeouts Occur?
Bearish fakeouts are not random. They are engineered by the dynamics of liquidity, trader psychology, and institutional behaviour. To understand why these patterns are so common and effective, we must look at how markets function beneath the surface.
When price approaches a well-watched resistance level, a significant number of traders are paying attention. Some places buy stop orders above resistance, anticipating a breakout. Others have stop-losses for their short positions just above the level. When price finally pushes through resistance, it triggers both sets of orders, creating a surge in buying activity and a spike in volume.
This burst of liquidity is exactly what institutional traders look for. Large players often cannot enter or exit positions without moving the market against themselves. They use the false breakout pattern to create liquidity pockets. By pushing price above resistance, they trigger a flood of buy orders. Once enough orders are filled, they reverse the move, selling into the buying pressure and driving the price sharply lower. This is the essence of the bearish fakeout: using the crowd’s expectations against them.
The trading range reversal that follows is usually sharp and decisive. Retail traders, caught in the wrong direction, scramble to exit their positions. Stop-losses get hit. New short-sellers join the move, accelerating the downward momentum. The result is a powerful, often short-lived, bearish swing that offers outsized profits to traders who anticipated the fakeout.
The Psychological Trap: Bull Trap Trading Explained
Bull trap trading is the psychological engine behind the bearish fakeout. The majority of retail traders are conditioned to look for breakouts. They see resistance as a ceiling: once the price breaks through, it should keep rising. The fear of missing out, or FOMO, drives them to enter trades the moment the price pokes above resistance.
However, real markets rarely behave in a straight line. Institutions and professional traders understand this retail psychology and exploit it. The bull trap trading setup uses the natural desire to catch big moves against the crowd. The more obvious the resistance level, the more likely it is to attract buyers and set up a bearish fakeout.
Classic Bull Trap Trading Example
Imagine the S&P 500 has been consolidating below a round number, say 4,500. After several attempts, the price breaks above with a large green candle. Headlines scream about a breakout, and social media buzzes with excitement. Yet, within the hour, price fails to build on the move. Sellers overwhelm buyers, the price tumbles below 4,500, and the market reverses sharply. Those who bought the breakout suffer losses. Those who anticipated the bearish fakeout and went short are rewarded with quick gains.
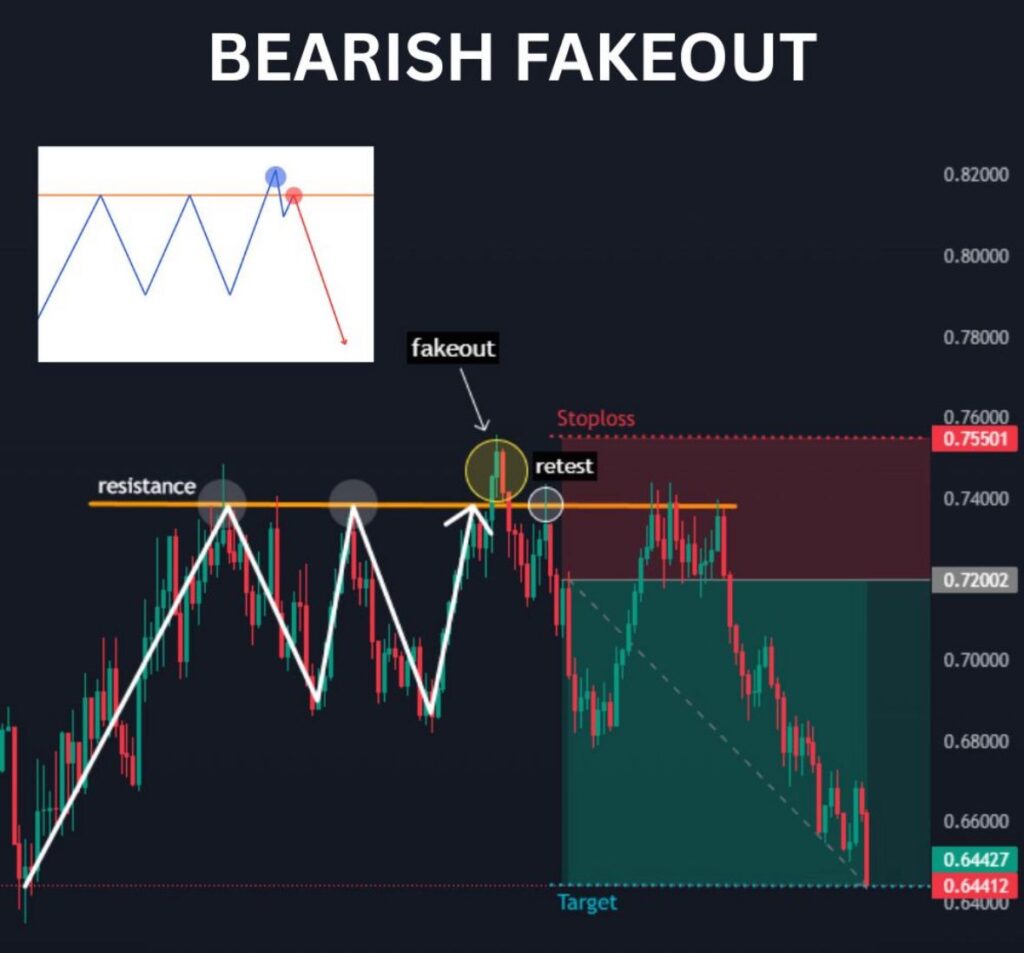
Anatomy of the Bearish Fakeout Pattern
The bearish fakeout follows a sequence of events that can be identified and used to structure trades. Here’s a closer look at each stage.
1. Range-Bound Price Action
The market is trading within a well-defined range, bounded by horizontal support and resistance. There are multiple touches at both ends, signalling that traders are paying attention to these levels.
2. Breakout Above Resistance
A strong bullish candle pushes the price above the established resistance. This move is often accompanied by increased volume, as buy stops and breakout orders are triggered.
3. Failure to Hold the Breakout
Instead of following through, price stalls above resistance. The next few candles show indecision, small bodies, or reversal patterns. The momentum that pushed the price higher quickly fades.
4. Swift Reversal Back Below Resistance
Price drops back under resistance, often with a large bearish candle. This is the signal that the breakout has failed and a bearish fakeout is underway.
5. Retest of Resistance as New Resistance
After the reversal, price may come back up to test the old resistance, now acting as new resistance. If this level holds, it offers the ideal entry point for a short trade.
6. Accelerated Move Downward
With breakout traders trapped and new sellers joining in, price falls rapidly to the next key support level or the bottom of the previous range.
Understanding these steps helps traders spot the false breakout pattern in real time and prepares them to act with confidence.

Developing a Bearish Fakeout Strategy
Trading the bearish fakeout is not about predicting when it will happen but about reacting intelligently when it does. Here’s a detailed approach to trading this pattern successfully.
First, spend time scanning markets for range-bound conditions. The best bearish fakeout opportunities arise in markets that have been oscillating between support and resistance, not in strong trends. Focus on timeframes that filter out noise. Four-hour and daily charts are often more reliable than lower timeframes.
Once you have identified a promising setup, wait for the price to break above resistance. Do not enter trades on the breakout. Instead, observe how price behaves in the minutes or hours that follow. If the move stalls and fails to find buyers above resistance, prepare for a reversal.
The confirmation comes when the price closes back below resistance. Conservative traders may wait for a retest of the level from below. If price attempts to reclaim resistance and fails, this is your entry signal for a short trade. Enter the position and place a stop-loss above the fakeout high. Your target should be the next major support or the bottom of the previous range.
Key Factors for a Profitable Bearish Fakeout Strategy
Several elements make this strategy consistently profitable. First, it capitalises on the emotional errors of retail traders. Most lose money by chasing moves without confirmation. Second, it uses risk management to limit losses. The distance from entry to stop-loss is usually small, while the potential reward is much larger. This creates a favourable risk-to-reward ratio. Third, it leverages the power of false breakout patterns and trading range reversals, which occur with surprising regularity.
Market Context Matters
The context in which a bearish fakeout occurs is crucial. Ranging markets, as noted, are best. Avoid trading fakeouts during major news releases or in strong trending environments. News events can create volatility that overrides technical patterns. Trending markets are more likely to see true breakouts rather than fakeouts.
Confirmation is Critical
Never assume a breakout is fake simply because price moves above resistance. The key confirmation is the swift return below the level and failure to reclaim it on a retest. Volume can provide extra confirmation. If volume spikes on the breakout and on the reversal, institutional players are likely involved.
Patience Pays
One of the biggest mistakes traders make is acting too early. They short every breakout, only to watch the price continue higher. Waiting for clear confirmation and a failed retest of resistance dramatically increases the odds of success.
Advanced Applications: Bearish Fakeout in Different Markets
The principles of the bearish fakeout strategy extend far beyond forex. Let’s explore how this setup works in stocks and cryptocurrencies.
Stock Market: Bearish Fakeout Example
Consider Tesla stock trading in a range between $800 and $850. After weeks of sideways movement, the stock surges to $855 on strong volume. Financial news outlets declare a breakout. However, within a few hours, selling pressure pushes the stock back below $850. After a weak retest, the price collapses to $810. Those who traded the bearish fakeout strategy profited handsomely, while breakout chasers suffered losses.
Cryptocurrency: Bearish Fakeout on Ethereum
In the crypto market, fakeouts are especially common due to volatility and emotional trading. Suppose Ethereum has resistance at $2,000. Price breaks above $2,020, only to reverse and close below $2,000. A failed retest follows. Within hours, Ethereum drops to $1,900. Recognising the false breakout pattern allows savvy traders to ride these moves for quick profits.
Commodities: Gold’s Bearish Fakeout
Gold often trades in well-defined ranges. If gold pushes above $2,050, stalls, and returns below, the same strategy applies. A short position after the failed retest can yield strong gains as price falls to support at $2,000.
Common Mistakes to Avoid in Bearish Fakeout Trading
Trading the bearish fakeout is simple, but not easy. Many traders repeat common mistakes that cost them money.
One frequent error is anticipating the fakeout before it actually happens. Jumping into a short trade as soon as price hits resistance is risky. Pride can break out for real, leaving you trapped. Always wait for the confirmation of the false breakout pattern.
Another mistake is ignoring market context. Trying to trade fakeouts in trending markets or during high-impact news is a recipe for failure. Stick to range-bound environments for best results.
Some traders use tight stops, which can lead to repeated small losses. Others skip stop-losses altogether and risk blowing up their accounts. Good risk management is non-negotiable.
Impatience is a third problem. The market will tempt you to act quickly. Often, the best trades come to those who wait for all the pieces to line up: the breakout, the failed move, the retest, and the confirmation.
The Role of Volume and Price Action in Bearish Fakeout Strategy
Volume analysis can greatly improve the odds of identifying a bearish fakeout. A spike in volume on the initial breakout, followed by another spike on the reversal, often signals institutional involvement. These players have the capital to move the market, and they use liquidity pockets created by the crowd to enter and exit their trades efficiently.
Price action also matters. Look for wicks above resistance, doji or spinning top candles, or bearish engulfing patterns at the retest. These are all signs of a failed breakout and can strengthen your conviction.
Real Profits: Risk-Reward and Trade Management
The best part of the bearish fakeout strategy is the asymmetric risk-to-reward profile. By waiting for confirmation and entering after a failed retest, you can keep stops tight. Your profit target is usually much farther away, giving you a reward that is two or three times your risk.
Consistently applying this method reduces the impact of losing trades and amplifies your winners. Over time, this edge is what separates successful traders from the rest.
Trade Management Example
Suppose you short after a failed breakout at 1.3100 in EURUSD. Your stop is 20 pips above the entry, while your target is 60 pips lower at support. Even if you win only half your trades, you come out ahead.
Mastering the Emotional Side of Bearish Fakeout Trading
Trading is as much about psychology as it is about strategy. The bearish fakeout challenges your discipline. You must resist the urge to chase breakouts, accept missed opportunities, and trust your edge.
Keep a trading journal to track your fakeout setups. Review your winners and losers to spot patterns. Did you enter too early? Did you ignore the confirmation? Are you trading only in ranges? This self-reflection will refine your approach and increase your confidence over time.
Using Technology: Charting Tools and Alerts
Modern charting platforms allow you to set alerts at key resistance levels. Instead of watching charts all day, let technology work for you. When price approaches a potential fakeout zone, get notified and watch for the pattern to unfold.
Some traders use volume indicators, candlestick recognition tools, or even automated scripts to highlight possible false breakout patterns. Use these tools as a supplement, but always rely on your understanding of market structure and context.
Combining the Bearish Fakeout with Other Strategies
You can combine the bearish fakeout with other methods for even stronger results. For example, if you see bearish divergence on RSI at resistance as price fakes out, the odds of reversal increase. Likewise, if the market is overbought on a higher timeframe and a fakeout appears, the move down can be more pronounced.
Some traders blend price action with order flow tools. If you see aggressive buying above resistance suddenly turn into heavy selling, this is additional confirmation that the breakout is false.
Example of Bearish Fakeout Trade Execution
Let’s apply this approach to a real-world example using the GBPUSD pair. Suppose the market has been stuck between 1.2650 and 1.2750 for a week. Multiple failed attempts to break above 1.2750 have conditioned traders to watch this level closely.
On Monday, price surges through 1.2750, triggering buy stops and breakout entries. Volume spikes. For a few hours, the price hovers just above the level, showing small-bodied candles and wicks. Soon, a large red candle forms, driving the price back under 1.2750. The reversal is underway.
A patient trader waits for the price to retest 1.2750 from below. The level holds as resistance. On the next bearish candle, the trader enters a short position at 1.2740, places a stop-loss at 1.2770 (above the fakeout high), and targets 1.2650. Price accelerates downward as trapped buyers exit, and the trade hits the target within the day.
Summary: Profiting from Bearish Fakeouts
The bearish fakeout is a potent trading setup that uses the crowd’s psychology against them. By waiting for clear confirmation, using risk management, and focusing on range-bound markets, you put the odds in your favour.
- Identify clear resistance in a ranging market
- Wait for the breakout and failed move
- Enter shortly after confirmation and failed retest
- Use a stop above the fakeout high
- Target the next support or range low
Real profits come from discipline, patience, and a clear understanding of how market structure and psychology interact. Mastering the bearish fakeout strategy can be your edge in a world where most traders lose money chasing the wrong moves.
Frequently Asked Questions About Bearish Fakeouts
What is a bearish fakeout in trading?
A bearish fakeout occurs when price briefly breaks above resistance, triggers buy orders, then quickly reverses and drops, trapping buyers.
When is the best time to trade bearish fakeouts?
Bearish fakeouts work best in sideways or range-bound markets with established resistance and support. Avoid trending conditions.
How do I confirm a bearish fakeout?
Wait for the price to break above resistance and then return below. Look for a failed retest of resistance as confirmation before entering a short.
What indicators help with bearish fakeouts?
Volume analysis, RSI divergence, candlestick patterns at resistance, and price structure all provide valuable clues.
Can bearish fakeouts occur in all markets?
Yes, bearish fakeouts happen in forex, stocks, commodities, and crypto—anywhere clear levels and crowd behaviour exist.

Final Thoughts
Bearish fakeouts are among the most effective price action patterns for catching sharp reversals and quick profits. They occur because most traders make the same mistakes over and over, chasing moves without confirmation. With the right knowledge, patience, and discipline, you can spot these traps, execute your strategy, and consistently pull profits from markets where others get caught. Make the bearish fakeout strategy part of your playbook, and turn other traders’ losses into your wins.
Read here to learn more about “Interest Rates in Forex Trading: How They Impact Currency Prices”.

I’m Chaitali Sethi, a financial writer and market strategist focused on Forex trading, market behaviour, and trader psychology. I simplify complex market movements into clear, practical insights that help traders make better decisions and build a stronger trading mindset.