

The Bearish Rectangle is a favourite tool for traders seeking simple, reliable ways to ride a trend. This classic chart setup turns confusing sideways action into a clear roadmap for confident decision-making. The Bearish Rectangle pattern is so effective because it captures the psychological pause that often happens in strong downtrends. When you learn to spot this rectangle chart pattern, you gain an edge across forex, stocks, and crypto—anywhere a market is trending.
Traders often search for that “aha” moment—a signal that stands out, removes hesitation, and makes entry and exit rules obvious. In the Bearish Rectangle, you find that rare mix of visual clarity and strategic simplicity. It not only highlights periods where sellers take a breather, but it also provides a concrete method to anticipate the next major move. If you have ever missed a trade because you were unsure whether the trend would continue, understanding the bearish rectangle can transform that uncertainty into opportunity.
For both new and seasoned traders, the rectangle chart pattern offers a window into real-time market psychology. It helps you move beyond guesswork, letting you approach every breakout and breakdown with a plan rooted in structure—not just hope. Let’s explore how the Bearish Rectangle works, why it’s trusted by professionals, and how you can use it to trade with more confidence, discipline, and results.
How the Bearish Rectangle Pattern Forms
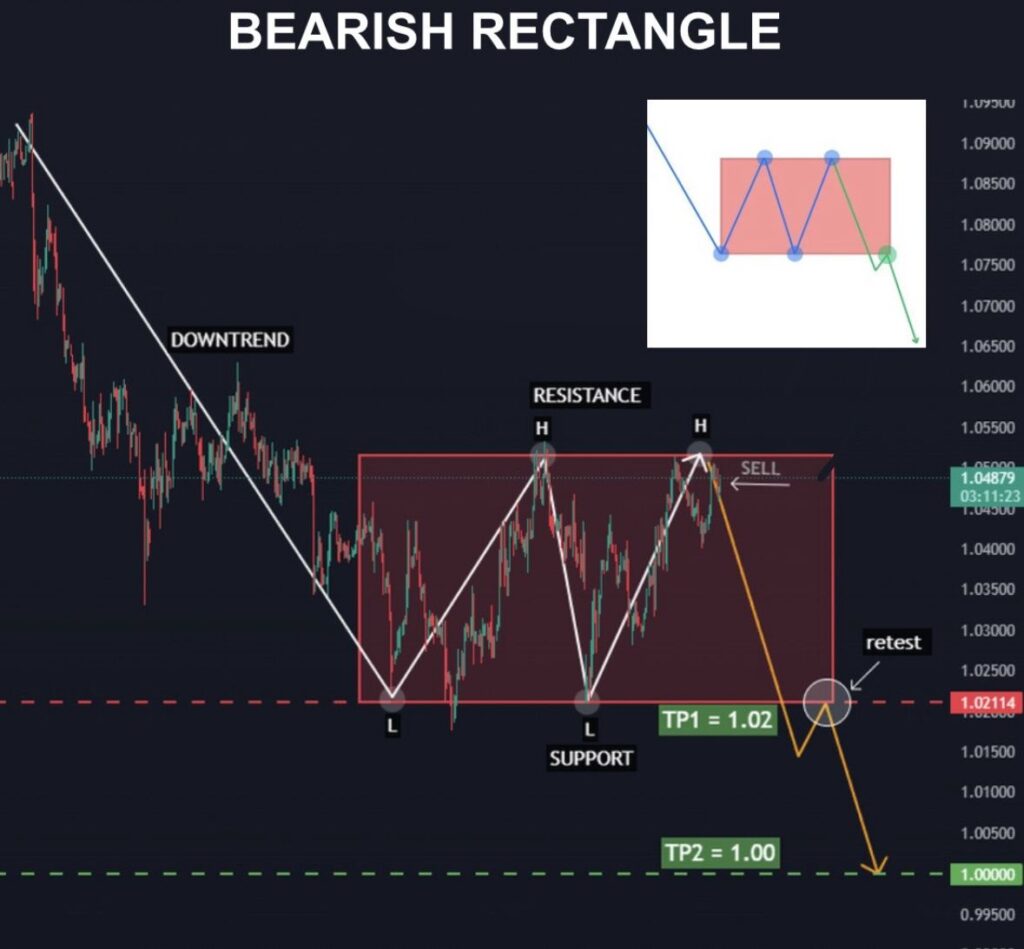
Every bearish rectangle pattern begins with a powerful price drop. Sellers are in control, and the market falls rapidly. Eventually, this momentum slows. Instead of reversing, price begins to move sideways. Buyers and sellers reach a temporary agreement. The result is a tight, horizontal band on the chart. The Bearish Rectangle is born.
During this stage, price bounces between two horizontal levels—support on the bottom, resistance on the top. This sideways movement is called downtrend consolidation. It is a sign that neither buyers nor sellers have enough conviction to break the range—yet. The more times the price touches both boundaries, the clearer the rectangle chart pattern becomes.
Imagine a currency pair like EUR/USD drops from 1.1000 to 1.0840 in a day. Over the next week, price trades between 1.0835 and 1.0880, never breaking out. This sideways drift is textbook Bearish Rectangle trading. On the sixth day, the price closes under 1.0835, confirming the pattern and launching the next move down.
Why the Bearish Rectangle Pattern Matters
The Bearish Rectangle pattern is important because it captures real market psychology. After a strong sell-off, traders are unsure what comes next. Sellers pause to secure profits. Some buyers see the range as an opportunity to bet on a reversal. However, the larger trend—shown by the preceding drop—remains bearish. This is why the rectangle chart pattern so often signals the return of momentum once the price breaks below support.
The Bearish Rectangle trading approach helps avoid false starts and whipsaws. Instead of guessing, you wait for confirmation. The setup works well on any timeframe and is easy to see. Downtrend consolidation builds tension. When that tension breaks, it can lead to sharp, profitable moves.
Steps to Trade the Bearish Rectangle with Confidence
Trading the bearish rectangle does not require special indicators or complicated setups. You need only patience, a clean chart, and the discipline to wait for the right moment. Begin by spotting a clear downtrend. The Bearish Rectangle pattern should follow a sharp, obvious move lower. Next, mark the horizontal support and resistance lines. As price bounces between them, watch for at least two touches at each level.
Volume often fades as downtrend consolidation continues. This signals trader indecision and a likely buildup of orders at both boundaries. Wait for a full candle to close below support before acting. This is your confirmation to enter a short trade. Place your stop above resistance. To set a profit target, measure the height of the rectangle chart pattern and project that distance downward from the breakdown point.
Let’s look at an example from equities. Tesla falls from $220 to $204 after weak guidance. Over the next several days, the price moves between $203.80 and $206.50, bouncing but never breaking out. Once the stock closes under $203.80, sellers regain control, and the stock slides quickly to $198.
The Role of Downtrend Consolidation in the Pattern
Downtrend consolidation is the force that makes the bearish rectangle work. Trends do not move in straight lines. Sellers need time to take profits and regroup. Buyers look for bargains but have no lasting strength in a bearish market. The rectangle chart pattern forms when this push and pull settles into a horizontal standoff.
Each bounce inside the Bearish Rectangle adds to the buildup. Orders accumulate just below support and above resistance. The longer the range holds, the more energy gets stored for the eventual breakout. When price finally breaks down, stop-losses trigger and new sellers jump in, pushing the move even further.
Consider Bitcoin as an example. After a sharp drop from $46,000 to $41,500, the price trades sideways between $41,300 and $41,900. Downtrend consolidation persists for four days. Once the price closes below $41,300, Bitcoin tumbles to $40,100 in a matter of hours.
Why Bearish Rectangle Trading Is So Reliable
The Bearish Rectangle pattern offers several advantages. It is easy to recognise, even for new traders. The pattern’s rules are clear and objective. By focusing on downtrend consolidation and waiting for a real breakout, you avoid guessing. The rectangle chart pattern gives you well-defined entries, stops, and targets.
Market psychology also supports this setup. Most traders wait for clarity after a big move. As orders build inside the Bearish Rectangle, the tension grows. The rectangle chart pattern harnesses this tension. Once released, the move is strong and often one-sided.
Mistakes to Avoid When Using the Rectangle Chart Pattern
Even though Bearish Rectangle trading seems simple, common mistakes can ruin results. One big error is jumping in before confirmation. Never enter on a mere touch of support or resistance. Wait for a clear close below support before selling.
Another mistake is trading rectangles that form without a clear prior downtrend. The Bearish Rectangle is a continuation setup. It is not effective as a reversal signal. Avoid rectangles with sloping boundaries or uneven touches—they are less reliable.
Stops placed too close can also be problematic. Allow room above resistance to avoid getting stopped out by normal volatility.
How to Improve Bearish Rectangle Trading
To get even better results, you can add simple filters to your Bearish Rectangle trading plan. Some traders use momentum indicators like RSI or MACD to confirm bearish strength as the rectangle matures. Watching volume for a spike on the breakout can provide more confidence in the move.
Combining the rectangle chart pattern with key moving averages or trendlines adds another layer of confirmation. In trending markets, several bearish rectangles may form in sequence. This stair-step effect can allow traders to compound gains by entering on each confirmed breakout.
Consider a forex example. GBP/JPY falls sharply, then spends three days moving between 184.20 and 184.95. Volume drops. On the fourth day, the price closes under 184.20, and momentum accelerates. Each time a new bearish rectangle forms, it presents another chance to trade with the trend.
Rectangle Chart Pattern Across Markets
The rectangle chart pattern is not limited to one asset class. It appears everywhere trends and human psychology intersect. In forex, you see it after major news releases. In stocks, it often shows up following earnings surprises. Crypto markets produce rectangles during regulatory headlines or periods of extreme volatility.
No matter the market, the Bearish Rectangle trading approach remains the same. Wait for the trend, let downtrend consolidation set up the range, and trade only on confirmation.
Trading Psychology and the Bearish Rectangle
Understanding the psychology behind the bearish rectangle helps you trade with confidence. During consolidation, bulls and bears are both uncertain. The crowd is on edge, waiting for a sign. The rectangle chart pattern gives structure to this emotion. The trader who waits for the real breakout is rewarded when the market finally commits.
Each bearish rectangle you trade builds discipline. Over time, you learn to act only on confirmation and ignore noise. That mindset is a major advantage.
Bearish Rectangle for All Trading Styles
Whether you are a day trader, swing trader, or long-term investor, the bearish rectangle pattern fits your strategy. On short timeframes, it delivers quick breakout trades. On daily or weekly charts, it captures larger moves. You can use it to scale into bigger trends or take profits with precision.
Consider the S&P 500 as an example. After dropping from 5,100 to 4,940, the index spends eight sessions trapped between 4,935 and 4,970. A break below 4,935 sends the index quickly down to 4,880.
Final Thoughts: Turn Patterns Into Profits
The Bearish Rectangle is more than just a technical formation. It is a system for turning sideways chop into clear, confident trading decisions. By focusing on downtrend consolidation, clear boundaries, and only acting after real confirmation, you take the guesswork out of trading.
Mastering the rectangle chart pattern lets you see opportunity where others see confusion. Stick to the rules, trust the structure, and let the Bearish Rectangle pattern guide you toward trading success.
Read here to learn more about “Bearish Fakeout Explained: Simple Strategy for Real Profits“.

I’m Chaitali Sethi, a financial writer and market strategist focused on Forex trading, market behaviour, and trader psychology. I simplify complex market movements into clear, practical insights that help traders make better decisions and build a stronger trading mindset.