
The ascending triangle pattern stands as one of the most recognised and dependable formations in technical trading. It visually captures the ongoing struggle between buyers and sellers that eventually ends in a decisive breakout. Traders and analysts across forex, equities, and crypto markets rely on this formation because it combines market structure, sentiment, and momentum into a single clear setup.
At its core, the ascending triangle pattern tells the story of building optimism. Each new higher low shows that buyers are becoming more confident, entering the market earlier with every retracement. The flat resistance line above, meanwhile, marks where sellers continue to defend their positions. This tug of war creates a tightening price range, revealing the growing pressure that typically leads to an explosive move.
When price finally breaks above resistance, it confirms the continuation pattern in trading and signals that buyers have gained control. The breakout is often supported by higher trading volume, improved liquidity, and sometimes institutional participation. These elements combine to create strong, sustainable rallies that reward traders who wait patiently for confirmation.
In today’s highly volatile markets, structure matters more than ever. The ascending triangle in technical analysis givestraders a defined framework for identifying reliable setups with clear entry, exit, and stop levels. It allows traders to trade based on logic, not emotion, and to use data instead of guesswork.
By combining the pattern with analytical tools such as moving averages, Bollinger Bands, or momentum indicators, traders can filter noise and focus on high-probability signals. This makes the Ascending Triangle Pattern not just a visual formation but a complete trading strategy adaptable for swing, positional, and even intraday styles.
Understanding the Structure of the Ascending Triangle Pattern
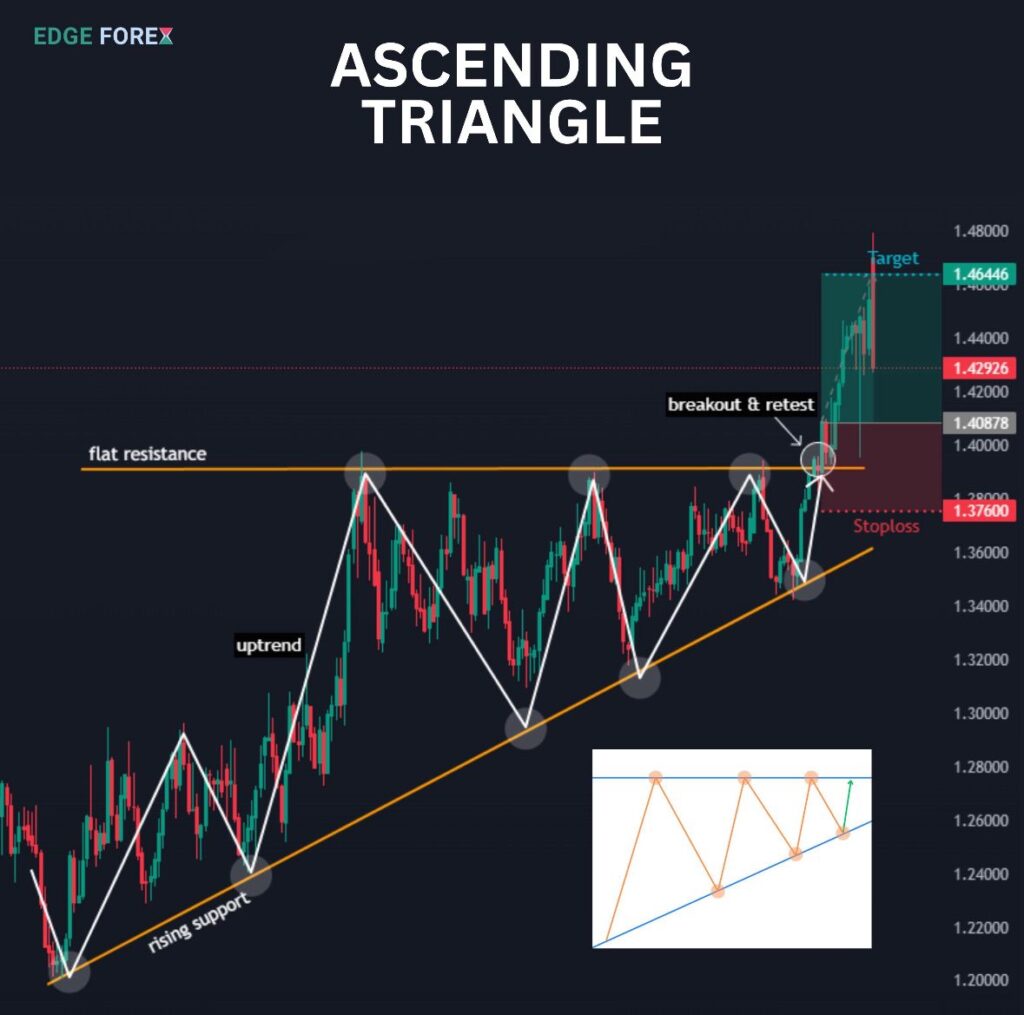
An ascending triangle forms when price movement becomes compressed between two converging boundaries — a horizontal resistance level on top and an ascending trendline beneath. The upper line represents the ceiling where sellers repeatedly emerge, while the rising trendline reflects growing demand as buyers enter at higher levels each time.
Over time, this price action creates a visible triangle shape that traders can identify on a chart. The beauty of this setup lies in its simplicity: the horizontal line shows where supply sits, and the rising base reveals where demand increases. When these two forces meet, energy builds, eventually leading to a breakout.
A textbook ascending triangle consists of at least two swing highs forming the flat resistance line and two or more higher lows shaping the upward trendline. The pattern becomes stronger when accompanied by declining volume inside the triangle, followed by a surge during the breakout.
This decline in volume before the breakout represents market indecision—a calm before the storm. Once the breakout occurs, volume expansion confirms renewed momentum. The ascending triangle in technical analysis often forms during ongoing uptrends, suggesting a pause before the next leg higher. However, it can also appear after long consolidations, indicating a fresh trend beginning.
Traders rely on this setup because it visualises a healthy market structure, where accumulation replaces uncertainty. Understanding its geometry and context ensures traders interpret it correctly rather than mistaking it for similar patterns.

What the Ascending Triangle Reveals About Market Psychology
Behind every ascending triangle pattern, there’s a story of collective psychology. It represents how market participants — institutions, retail traders, and algorithms — express conviction and fear through price action.
The rising trendline shows that buyers are willing to pay increasingly higher prices, reflecting growing optimism. Every time sellers push prices back from resistance, they meet stronger demand at higher levels. This behaviour demonstrates accumulation. The flat resistance, on the other hand, shows where supply temporarily caps upward movement.
Over time, these reactions narrow the trading range, creating a coiled spring effect. The tension eventually releases when buyers overpower sellers, causing an explosive move known as the Ascending Triangle Breakout Strategy. The sharp breakout candle accompanied by strong volume signals that control has shifted fully to the buyers.
This pattern is a visual representation of how sentiment evolves — from hesitation to commitment. Unlike random movements, it builds a predictable rhythm that allows traders to anticipate change.
The ascending triangle in technical analysis often forms during retracements or consolidation phases within ongoing trends. Institutional traders use such patterns to scale into positions quietly without causing large spikes. When the breakout finally happens, retail traders notice, amplifying the momentum.
This psychological transition from neutrality to bullishness explains why this formation consistently produces high-probability outcomes. It aligns price action with trader emotion — a critical advantage in a field where timing and conviction define profitability.
Real Market Example:
Consider the EUR/USD pair forming an ascending triangle pattern on the four-hour chart. Resistance sits at 1.1000, while higher lows develop from 1.0850 to 1.0950. Each time sellers reject the price near resistance, buyers return more aggressively, building momentum beneath the surface.
After several weeks of this narrowing range, a strong bullish candle closes above 1.1000 with volume nearly double the average. Traders now interpret this as a confirmed breakout. The ascending triangle breakout strategy suggests measuring the triangle’s height—in this case, 150 pips—and projecting it above the breakout point. The estimated target becomes 1.1150.
Following the breakout, EUR/USD rallies sharply, hitting 1.1150 within days before consolidating again. This move validates the pattern’s reliability and how its geometry reflects actual market pressure.
In stock markets, similar behaviours occur. For instance, when Apple (AAPL) formed an ascending triangle near $180 in 2023, it broke out and surged to $190 within a few weeks, backed by rising institutional buying volume.
Such examples confirm that the ascending triangle in technical analysis isn’t just theoretical. It reflects measurable accumulation and supply absorption. Traders who understand these dynamics can trade confidently without relying on predictions — instead, they respond to structure and confirmation, not speculation.
Comparing the Ascending Triangle to Similar Patterns
Many formations look alike, but their implications differ. Distinguishing between them helps traders choose the right Continuation Pattern in Trading for their strategy.
| Pattern Type | Structure | Market Bias | Key Signal |
|---|---|---|---|
| Ascending Triangle | Flat resistance, rising support | Bullish | Breakout above resistance |
| Descending Triangle | Flat support, falling resistance | Bearish | Breakdown below support |
| Symmetrical Triangle | Converging trendlines | Neutral | Breakout either direction |
| Rising Wedge | Both trendlines rising | Bearish reversal | Breakdown after weakening trend |
The Ascending Triangle Pattern is bullish by nature, unlike the descending triangle, which typically signals bearish continuation. The difference lies in slope direction: rising support shows buying strength, while falling resistance in a descending triangle signals fading demand.
Symmetrical triangles, by contrast, don’t predict direction; they merely show compression. A rising wedge, meanwhile, often leads to reversals since the slope steepens unsustainably.
By learning these distinctions, traders reduce confusion and improve decision-making. Recognising that the Ascending Triangle in Technical Analysis forms from rational market behavior buyers absorbing supply helps traders align with probability instead of guessing direction.

Trading the ascending triangle with confidence.
It takes more than recognition to trade the ascending triangle pattern successfully. It demands patience, timing, and confirmation. Entering too early exposes traders to false signals, while waiting too long may reduce profit potential.
The process usually unfolds in stages: first, identify resistance and support lines with at least two touches each. Next, watch for declining volume as the range tightens — this signals that volatility is compressing. Then, wait for a decisive breakout above resistance.
Professional traders often seek three confirmations before entry:
- A candle closes above resistance.
- Volume increases substantially.
- The breakout level holds new support.
Once confirmed, entry occurs slightly above the breakout candle’s high. This structured method, a key part of the Ascending Triangle Breakout Strategy, ensures traders participate in real moves rather than false starts.
The pattern thrives in markets with momentum. In equities and forex, breakouts can accelerate quickly as new traders pile in. However, cautious risk management remains essential — no formation is perfect, and false breakouts occasionally occur.
Trading with confidence means aligning technical confirmation, market trend, and volume context. When all three factors align, the ascending triangle pattern presents one of the clearest opportunities for profitable trading. es.
Entry, Target, and Stop-Loss Placement Explained
The ascending triangle in technical analysis provides structure for entries and exits — a major reason traders favour it. Entry typically follows a confirmed breakout candle closing above resistance. However, smart traders also analyse volume; without sufficient participation, breakouts often fail to materialise. il.
Profit targets are calculated using the “measured move” technique. The vertical distance between the first swing high and swing low within the triangle determines the expected upside projection. Adding that distance to the breakout point provides a logical target.
For example, if the base of the triangle spans 200 pips and the breakout occurs at 1.1000, the target sits near 1.1200. This predefined target helps remove emotional bias.
Stop-loss placement protects traders from invalidation. A stop is often set below the last higher low or beneath the ascending trendline. This ensures that only a complete breakdown of structure triggers an exit.
A well-planned ascending triangle breakout strategy integrates all three elements—entry, target, and stop-loss—into a consistent plan. Many professional systems utilise a risk-to-reward ratio of 1:2 or better to ensure long-term profitability, even if only half of the trades are successful. ed.
By combining logical placement with risk control, traders convert a geometric pattern into a disciplined trading framework — one that reflects structure, probability, and psychology together.
Multi-Timeframe Analysis of Ascending Triangles
The ascending triangle pattern appears across all timeframes, offering flexibility to traders with different objectives. Intraday traders may spot it on 15-minute charts for fast moves, while position traders analyse daily or weekly charts for long-term trends.
Multi-timeframe confirmation enhances accuracy. When the same pattern forms on higher and lower charts simultaneously, it signals stronger conviction. For example, a 4-hour ascending triangle aligning with a daily uptrend often precedes major breakouts.
Shorter timeframes provide tactical entries, while longer ones define direction. This approach ensures that trades align with broader momentum rather than oppose it. I The ascending triangle in technical analysis, therefore, adapts seamlessly to any trading style. le.
Algorithmic traders even use pattern-recognition software to identify these structures automatically. Backtesting reveals that triangles forming within established uptrends yield higher success rates than those in neutral markets.
This versatility makes the pattern a cornerstone of modern continuation patterns in trading frameworks—equallyeffective for discretionary and systematic traders.
Recognising and Avoiding False Breakouts
False breakouts are one of the most common challenges when trading the ascending triangle pattern. They occur when the price briefly moves above resistance only to reverse and fall back inside the triangle. Recognising warning signs helps prevent unnecessary losses.
Key signals of a false breakout include:
- Weak or declining volume during the breakout candle.
- Small candle bodies with long upper wicks indicate rejection.
- There are immediate pullbacks that close below the breakout level.
Traders can mitigate risk by waiting for confirmation. A strong breakout candle followed by at least one additional bullish candle above resistance improves reliability. Some traders wait for a retest—when the price revisits the breakout zone and holds—before entering.
Using momentum indicators like RSI or MACD can also confirm genuine strength. If momentum diverges negatively during breakout, caution is warranted.
The ascending triangle in technical analysis remains robust when traded with discipline. Avoiding early entries and filtering trades based on volume ensures that traders only act when market conviction supports the momentum. ve.
Trading Strategies for the Ascending Triangle
Strategy 1: The Retest Entry Method
This conservative technique involves waiting for the price to break out above resistance and then retesting that level as new support. The retest offers a low-risk entry point because traders can place stop orders just below the support level. r Although this technique may miss explosive immediate moves, it dramatically increases accuracy. cy.
The Ascending Triangle Breakout Strategy using retests works best in markets where liquidity allows for clean retouches, such as forex and blue-chip equities. It reduces false signals and ensures participation in moves backed by real momentum.
Strategy 2: The Projection and Continuation Method
Here, traders measure the height of the triangle and project it from the breakout point to estimate targets. This approach gives structure to profit booking and helps set trailing stops as price advances. When combined with moving averages or volume confirmation, it becomes a complete trading plan suitable for swing traders seeking structured setups.
Both strategies balance precision and flexibility — vital for mastering any continuation pattern in trading.
Using Indicators to Strengthen the Ascending Triangle
Utilising indicators enhances the strength of the ascending triangle pattern by adding confirmation to price action. While chart structures reveal market psychology, technical indicators help validate whether momentum and volume truly support the move. This combination of pattern recognition and data-backed analysis provides traders with a more reliable and evidence-based approach.
The ascending triangle in technical analysis becomes most effective when traders pair it with indicator readings that confirm accumulation, strength, and timing. These tools help filter out false signals and reveal when institutional participation supports the pattern.
Key indicators to monitor include:
- Volume Indicators: Rising volume during a breakout confirms real demand. When price breaks resistance with higher-than-average volume, it shows institutional traders entering the market. Without this volume confirmation, breakouts are more likely to fail or reverse quickly.
- Momentum Indicators: Tools like RSI and MACD measure the force behind a move. A rising RSI above 60 or a bullish MACD crossover near the breakout level signals momentum alignment with the breakout direction.
- Moving Averages: Breakouts that occur above major averages, such as the 50- or 200-period lines, add conviction to the setup. They also help traders identify whether the market structure supports continuation or reversal.
- Bollinger Bands: A squeeze phase before a breakout indicates volatility contraction. When price expands beyond the upper band, it usually marks the start of a strong momentum phase.
By combining these tools with clean structure and disciplined execution, traders transform the Ascending Triangle Pattern from a simple visual cue into a validated, data-driven trading signal. Confirmation builds confidence — and confidence builds consistency.
Confirming a Real Breakout
Confirming a genuine breakout is essential when trading the ascending triangle pattern. While many setups appear promising, only a few produce strong follow-through. Understanding how to verify authenticity separates professionals from impulsive traders.
A real breakout displays specific traits that align structure, momentum, and volume. Traders should look for:
- Strong bullish candles: Wide-bodied candles closing above resistance indicate decisive buying.
- Rising volume: Historical research suggests that triangles with at least a 40% increase in breakout volume have significantly higher success rates.
- Sustained follow-through: Prices should hold above the breakout level for several sessions instead of quickly returning below it.
- New support formation: Former resistance should act as fresh support. If pullbacks remain above that level, the market confirms strength and stability.
Volume confirmation remains the most crucial factor. It shows genuine participation rather than short-lived speculation. When combined with momentum readings and structure validation, traders gain high-confidence entries with defined risk.
The Ascending Triangle Breakout Strategy thrives when all signals align — structure, volume, and momentum. This evidence-based approach minimises emotional trading and maximises accuracy. Traders who wait for confirmation before entry often capture more sustainable and profitable moves while avoiding false breakouts that trap impatient participants.
In short, a valid breakout is not just about price — it’s about conviction. When structure, trend, and volume align, the ascending triangle in technical analysis becomes one of the most reliable continuation setups across all financial markets.
Common Mistakes Traders Make and How to Avoid Them
Even seasoned traders can misinterpret the ascending triangle pattern when emotions, impatience, or lack of confirmation cloud their judgement. While the pattern itself is reliable, execution errors often undermine its potential. Recognising these mistakes and learning how to avoid them helps traders use the ascending triangle in technical analysis effectively and consistently. ly.
Here are the most common mistakes traders make:
- Entering too early before breakout confirmation: Many traders jump in at the first hint of movement, assuming a breakout will follow. However, without a candle close above resistance and volume confirmation, premature entries often lead to whipsaws and unnecessary losses.
- Ignoring trend and volume context: The pattern thrives within strong, ongoing uptrends accompanied by healthy volume. Failing to check these elements can result in trading low-quality setups where momentum is weak.
- Placing stops too close to price action: Tight stops near the breakout zone may trigger prematurely due to normal volatility. Position sizing and adequate stop placement below higher lows are vital for survival.
- Over-leveraging positions: Traders sometimes increase position size out of confidence in the setup, forgetting that every continuation pattern in trading involves risk. Excessive leverage can magnify small mistakes into large drawdowns.
- Neglecting confirmation tools: Skipping volume, momentum, or moving average analysis reduces reliability. These tools often filter false signals and validate true breakouts.
These mistakes arise mostly from emotional trading — fear of missing out, impatience, or overconfidence. The ascending triangle in technical analysis rewards discipline, not haste. Waiting for confirmed signals, managing risk carefully, and trading with structured rules may reduce trade frequency, but it dramatically improves consistency.
Successful traders know that profitable trading isn’t about chasing every opportunity—it’s about mastering patience, precision, and psychology. By applying these lessons, the Ascending Triangle Pattern becomes not just a chart formation but a repeatable trading edge that reinforces confidence and long-term profitability.
Can the Ascending Triangle Pattern Be Bearish?
Although the ascending triangle pattern is inherently bullish, it can sometimes fail or even reverse. In rare cases within broader downtrends, the breakout occurs downward instead of upward. Such failed patterns trap optimistic traders and cause sharp reversals.
When that happens, the same energy that could have fuelled a rally now accelerates the decline. This situation demonstrates that no pattern can ensure success — context is crucial.
Traders should monitor trend direction, macro events, and volume. Weak momentum and fading volume often accompany a bearish breakdown from what appears to be an ascending triangle, indicating the need for caution.
Flexibility keeps traders adaptive and resilient even when expectations shift.
Strengths and Weaknesses of the Ascending Triangle Pattern
Key Benefits of the Ascending Triangle Pattern
The ascending triangle pattern is widely admired among traders for its clarity, structure, and ability to visualise market strength before a breakout. It turns raw price action into an easy-to-interpret framework, helping traders predict potential bullish continuation in a disciplined way.
This formation doesn’t rely on complicated indicators or lagging signals — instead, it reflects real-time market psychology. The horizontal resistance highlights where sellers are active, while the rising support line reveals growing buying confidence. Together, they form a pattern that shows pressure building below the surface.
The major advantages of the ascending triangle pattern include:
- Clarity and simplicity: Its structure is easily identifiable, even for beginners analysing charts for the first time.
- Defined rules: The flat resistance and ascending support provide clear breakout and stop-loss levels, reducing guesswork.
- Multi-market adaptability: It works effectively in forex, stocks, indices, and crypto markets with minimal variation.
- Improved discipline: By focusing on pattern completion, it helps traders follow a rule-based plan rather than emotions.
- Compatibility with indicators: It integrates seamlessly with momentum and trend-following tools like RSI, MACD, Bollinger Bands, and moving averages.
- Strong reliability: The pattern reflects institutional accumulation — where large traders build positions before pushing prices higher.
The ascending triangle in technical analysis serves as more than a visual sig. It helps traders establish a structured approach, build confidence, and maintain a consistent methodology. logy. Its pattern logic — higher lows meet steady resistance — shows that buying demand is intensifying while supply weakens.
Professional traders especially value this setup because it gives measurable outcomes. By calculating the height of the triangle and projecting it from the breakout, traders can determine realistic profit targets. This objective, mechanical process supports both swing and positional trading systems.
When paired with the Ascending Triangle Breakout Strategy, volume analysis, and strong risk management, this formation becomes a repeatable model for steady growth. Its simplicity, repeatability, and psychological accuracy make it one of the most reliable continuation patterns in trading, suitable for both short-term and long-term market participants.
Limitations and Practical Risks to Consider
Even a strong pattern like the ascending triangle pattern has weaknesses. Recognising its limitations ensures traders stay realistic, patient, and flexible — essential traits for survival in unpredictable markets.
This pattern’s success depends heavily on market conditions and participant behaviour. When volume is low or trends are unclear, false breakouts become common. Similarly, if traders act prematurely before confirmation, they may get trapped in failed setups.
The primary limitations and risks include:
- Market dependence: The pattern performs best during established trends with healthy volume. In flat markets, breakouts often lack momentum.
- Uncertain timing: While it reveals compression and potential, it doesn’t specify when the breakout will happen. Price can stay within the triangle for long periods, testing patience.
- False breakouts: Weak volume or manipulation can trigger temporary breaches that quickly reverse.
- External disruptions: Macroeconomic data, earnings reports, or geopolitical news can override technical patterns instantly.
- Context sensitivity: The same structure may produce different outcomes depending on timeframe, liquidity, or volatility.
- Overconfidence risk: Relying solely on geometry without confirming indicators or risk management can lead to losses.
To counter these limitations, traders must use confirmation tools — such as volume surges, trend direction, and momentum indicators — before committing capital. Setting realistic targets and placing protective stop-losses below recent higher lows adds security.
The ascending triangle in technical analysis represents probability, not certainty. It is powerful because it visually captures accumulation, but it still requires judgement and timing.
Smart traders integrate it with broader context — including trend strength, macro data, and volatility cycles — to validate breakout potential. This blended approach ensures they trade with evidence, not emotion.
Ultimately, while the ascending triangle pattern stands out as one of the most trustworthy bullish chart patterns, it demands patience and adaptability. Its real strength lies in how traders use it: not as a prediction, but as a structured guide to trade logic, timing, and control. When traded with awareness, confirmation, and discipline, this formation continues to offer one of the highest-quality setups across all markets.
Real-World Example:
Beyond forex, this pattern consistently appears in equities and cryptocurrencies. In 2023, Tesla (TSLA) formed an ascending triangle between $200 resistance and $180 rising support. After weeks of compression, the breakout pushed prices toward $230 within a month – a 15% move aligning perfectly with the pattern projection.
Similarly, in crypto markets, Bitcoin frequently forms ascending triangles near major support zones. In late 2020, BTC built an ascending triangle between $18,000 and $19,500 before breaking out toward $23,000, beginning its next bull leg.
These examples reinforce how universal the pattern is. Whether trading forex pairs or digital assets, understanding the ascending triangle in technical analysis provides traders a repeatable framework adaptable across markets.

Conclusion:
The ascending triangle pattern remains a cornerstone of technical trading because it simplifies complex market dynamics into a structured, testable setup. It embodies patience, accumulation, and eventual conviction.
By applying it through the Ascending Triangle Breakout Strategy, traders gain clarity in execution, knowing when to enter, where to exit, and how to protect capital. Whether you trade forex, stocks, or cryptocurrencies, this formation delivers insights that go beyond visual analysis.
It represents how markets truly operate — through cycles of buildup and breakout. When combined with risk management, indicator confirmation, and awareness of broader trends, the ascending triangle in technical analysis continues to be one of the most powerful and time-tested formations for traders aiming for consistency and confidence in 2025 and beyond.
Read here to learn more about “Descending Triangle in Trading and How It Signals Breakouts“

I’m Chaitali Sethi, a financial writer and market strategist focused on Forex trading, market behaviour, and trader psychology. I simplify complex market movements into clear, practical insights that help traders make better decisions and build a stronger trading mindset.