Spinning Top Candlestick: What Traders Must Understand
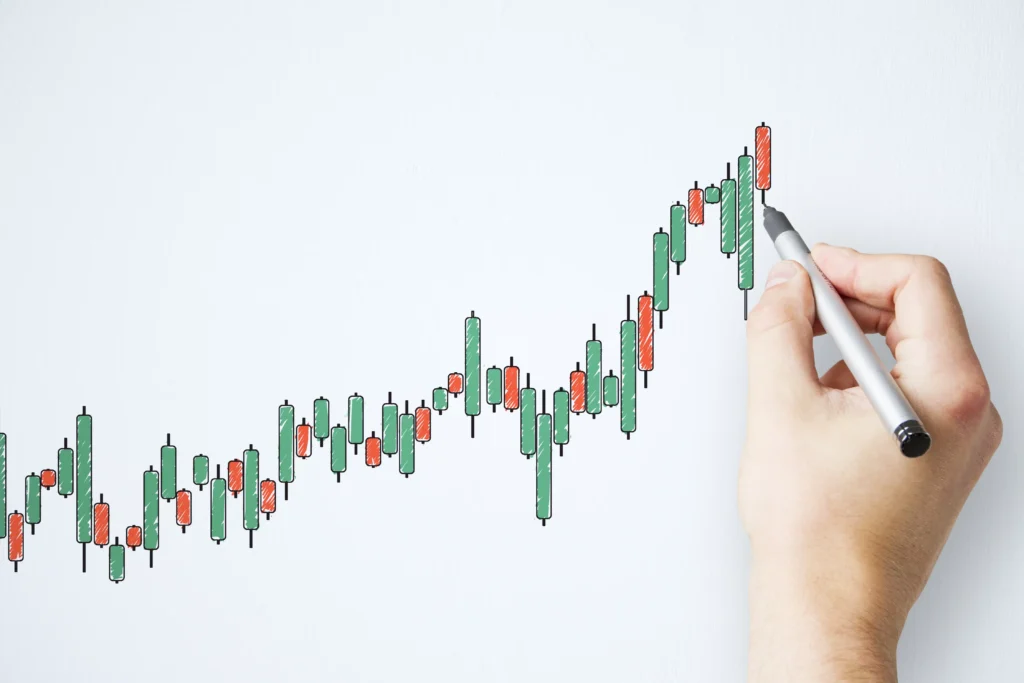
The Spinning Top Candlestick shows clear market hesitation and shifting momentum. Traders use its signals to identify trend pauses, potential reversals, and smarter entry decisions.

The Spinning Top Candlestick shows clear market hesitation and shifting momentum. Traders use its signals to identify trend pauses, potential reversals, and smarter entry decisions.
The Fed’s Third Rate Cut Crypto Impact triggers major market shifts, stronger liquidity flows, and clearer trading signals as Bitcoin and altcoins react to changing policy.

USD vs INR is touching new highs, and NRIs are asking if this is the right moment to transfer money to India. This guide explains timing signals and evidence-based insights.
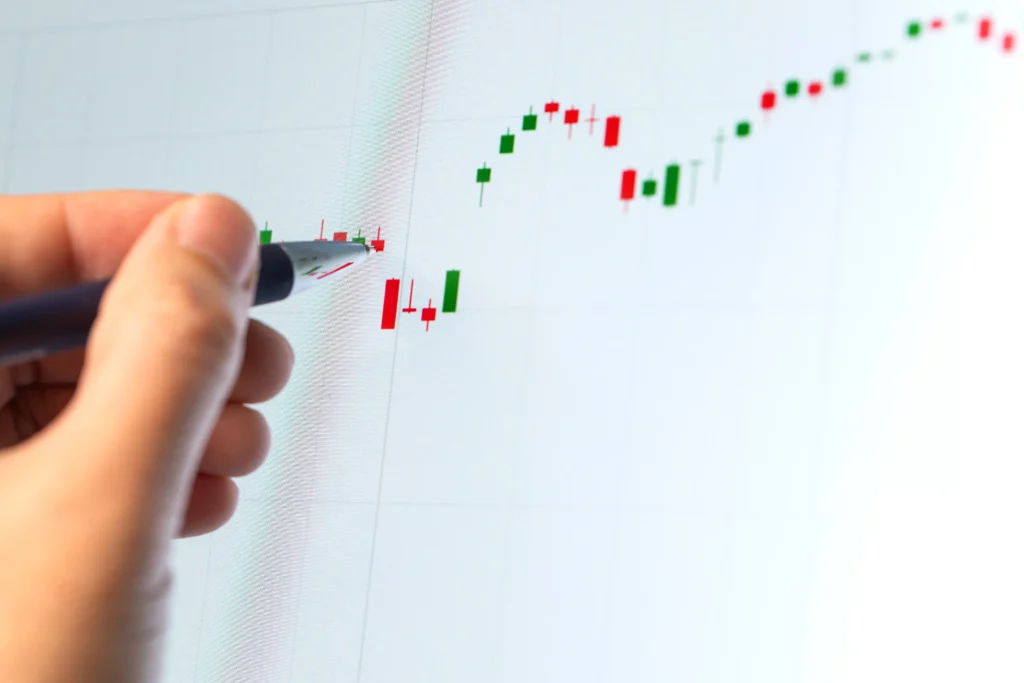
The Hanging Man Candlestick Pattern helps traders spot early trend weakness at market tops. This guide explains its structure, psychology, confirmation, and real trading applications.
The Time-Weighted Average Price offers stable, low-impact execution by spreading orders across time. TWAP reduces slippage, strengthens discipline, and supports traders in unpredictable market conditions.
A clear guide to Soft vs Hard Commodities with 2025 trends, key drivers, and practical insights to help traders navigate fast-changing global markets.

The Change of Character in Trading highlights early trend weakness and helps traders spot market shifts with greater clarity and confidence.

This guide breaks down BOS vs CHOCH to help traders read structure, confirm trends, and spot reversals early.
The 24-Hour Volume Indicator measures complete daily trading activity, showing true market participation, liquidity shifts, and the strength behind price movement.
Cumulative Volume Delta shows real buying and selling pressure that price alone hides. Traders use CVD to spot true strength, identify imbalance, confirm trends, and avoid false signals. This guide explains how CVD improves clarity and supports smarter trading decisions.