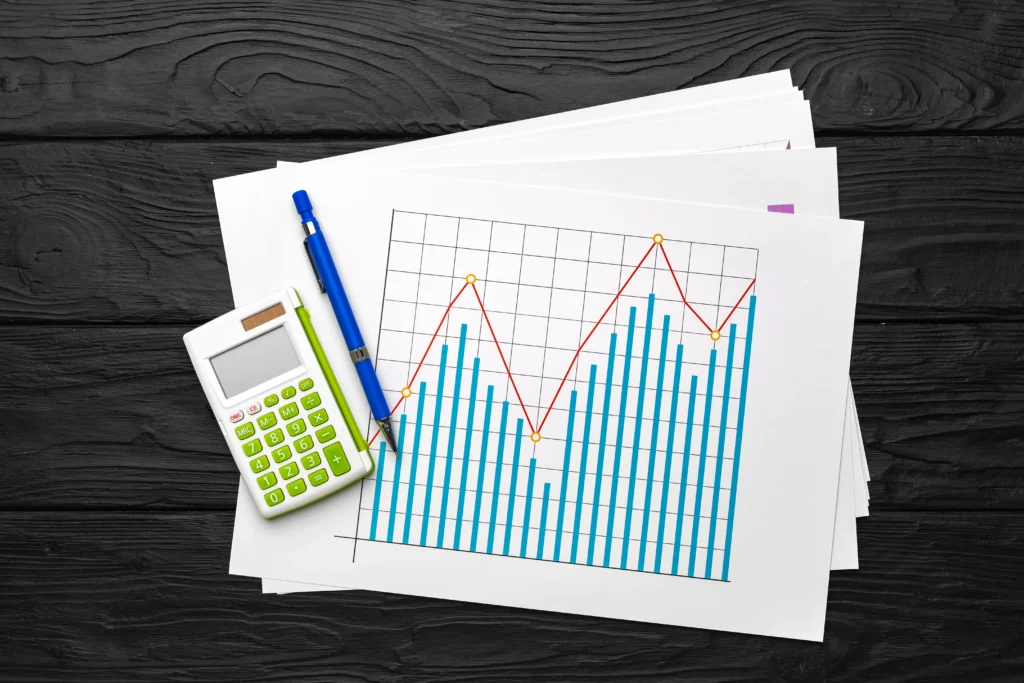
Line Graph Explained with Definition, Uses, and Examples
A line graph in 2025 explains data trends clearly. Learn its definition, types, uses, and examples to simplify complex information.

A line graph in 2025 explains data trends clearly. Learn its definition, types, uses, and examples to simplify complex information.

Understanding the Relative Strength Index (RSI) Indicator in 2025 helps traders read signals, apply strategies, and manage entries with confidence in all markets.

Rules followed by professional traders provide clarity in markets. With risk management and trading discipline tips, consistency in trading becomes sustainable over time.

Transaction Cost plays a vital role in 2025 markets. Explore its definition, types, and examples to understand how it impacts trading and business.

The Reversal Trading System helps traders in 2025 identify market turning points using reversal patterns, technical indicators, and disciplined counter-trend trading strategies.

Focusing on One Currency Pair in 2025 helps traders gain deep market insight, improve decision-making, and trade with greater precision and discipline.

Learn how switching timeframes mid-trade in 2025 helps traders keep clarity, control emotions, and align decisions across multiple charts for success.

This detailed Market Order vs Limit Order 2025 guide explains execution speed, price control, and practical scenarios to improve your trading accuracy and decision-making.

Understand Pullback in Trading and learn how to spot, trade, and manage them in 2025 for consistent profits across different markets.

Trading Gaps in 2025 offer opportunities for confident traders to spot momentum, execute precise entries, and profit from rapid market movements.