

Every market cycle tells a story, and few stories are as reliable as the double bottom pattern. Traders of all levels search for those moments when a downtrend finally exhausts itself and the bulls come roaring back. The double bottom pattern has become a favourite tool for traders in stocks, forex, crypto, and commodities, not only because it’s easy to recognise but also because it gives clear, actionable signals.
In this guide, you’ll explore every detail of the double bottom pattern: why it works, how to trade it step by step, how to confirm with volume and indicators, real examples, common mistakes, advanced strategies, and more. If you’re ready to spot bullish reversals early and trade with more conviction, this guide will help you get there. Let’s dive into the world of the double bottom chart pattern—a true classic in technical analysis in trading.
What Is the Double Bottom Pattern?
The double bottom pattern is one of the simplest and most effective bullish reversal patterns. It signals the end of a downtrend and the potential start of a new uptrend. The double bottom pattern looks exactly like it sounds: price forms two distinct lows at roughly the same level, with a peak or resistance zone in between.
This classic chart formation tells a story of market psychology. Sellers push prices down but hit a support level where buyers step in. Price rebounds but fails to break through resistance, then falls back to test the previous low. When sellers can’t break that support again, it shows exhaustion. If price rallies and breaks above resistance (the neckline), the double bottom chart pattern is confirmed, and a bullish reversal is likely underway.
The double bottom pattern is widely used in technical analysis in trading because it gives traders a clear structure, easy confirmation, and a logical trade setup.

Anatomy of the Double Bottom Chart Pattern
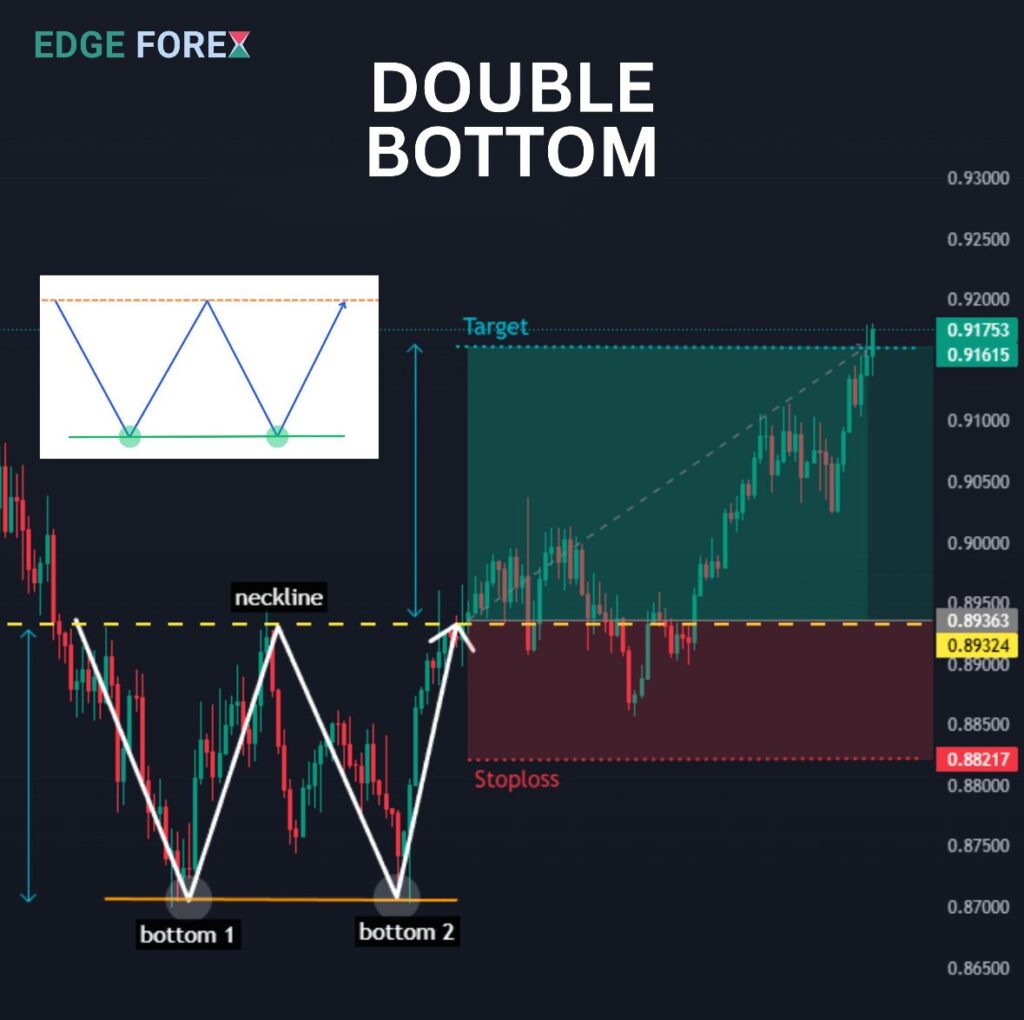
To truly understand the double bottom pattern, let’s break down its key components:
- First Bottom: Price makes a new low in a downtrend as selling pressure dominates. Buyers step in at support, causing a bounce.
- Interim Peak (Neckline): The bounce leads to a short-term rally, but price stalls at a resistance zone. Sellers take profit, or new sellers enter.
- Second Bottom: Price drops again but finds strong support at the same level as the first bottom. Sellers try but fail to push through, while buyers become bolder.
- Breakout: Price rallies once more, breaking through the neckline. This signals that bulls have taken control and a new trend is likely beginning.
The distance between the bottoms and the neckline is the “height” of the pattern, and this measurement is used to set price targets for the bullish reversal pattern.
Why the Double Bottom Pattern Works: The Psychology of Reversals
Every technical pattern tells a psychological story. The double bottom pattern is the visual evidence of a battle between persistent sellers and patient buyers.
- During the first bottom, the market is in a strong downtrend, with sellers confident and buyers mostly on the sidelines.
- As price bounces off the support, some sellers lock in profits, but the rally is weak, stalling at resistance.
- When the price drops again to retest the first bottom, many expect a new breakdown. If selling volume decreases and price holds, it means sellers are losing their grip.
- The second bottom is where the tide turns. Buyers gain confidence and step in, seeing the level as a bargain.
- When price surges and finally breaks above resistance, the market acknowledges that the downtrend is over. New buyers join in, fuelling a bullish reversal.
This reliable shift in sentiment is what makes the double bottom pattern a favourite for technical analysis in trading.
Recognising the Double Bottom Pattern on the Chart
Spotting the double bottom pattern is easier than many other reversal signals. Here’s a simple process:
- Look for a clear downtrend: The double bottom is only a reversal if it follows a sustained decline.
- Identify the first bottom: Mark the initial low where price finds support and bounces.
- Find the neckline: The interim rally creates a resistance level—the neckline—that price must break for confirmation.
- Watch for the second bottom: The price falls back but holds above or near the first bottom.
- Confirm with breakout: Only when price closes above the neckline does the double bottom pattern signal a real bullish reversal.
Tips for identifying a high-quality pattern:
- The two bottoms should be at similar price levels, ideally separated by at least a few bars (the more distance, the more reliable).
- The neckline should be clear, not muddled by choppy price action.
- Volume often decreases on the second bottom and spikes on the breakout.

How to Trade the Double Bottom Pattern: A Step-by-Step Guide
You don’t need to guess when trading the double bottom chart pattern. Here’s how experienced traders turn the pattern into profits:
Step 1: Confirm the Pattern
- Spot a clear, well-defined downtrend.
- Find two obvious lows at nearly the same price level, separated by a moderate rally.
Step 2: Draw the Neckline
- Mark the high between the two bottoms.
- Draw a horizontal or slightly sloped line across this level—this is your breakout zone.
Step 3: Wait for Confirmation
- Be patient. Enter only after a strong close above the neckline.
- Aggressive traders may enter on the breakout; conservative traders can wait for a pullback to the neckline.
Step 4: Place Your Stop Loss
- Set a stop loss just below the second bottom to protect against failed patterns or false breakouts.
Step 5: Set a Profit Target
- Measure the distance from the bottoms to the neckline.
- Project this distance upward from the neckline to set your first target.
Step 6: Manage the Trade
- Consider taking partial profits at the first target and letting the rest run if momentum remains strong.
- Adjust your stop to break even or trail it higher as price moves in your favour.
Example: Double Bottom Pattern in Real Market Conditions
Let’s look at a practical scenario in the stock market:
Imagine a technology stock drops from $80 to $55 (first bottom), then bounces to $65 (neckline), before falling again to $56 (second bottom). Sellers try to break support but fail. Buyers push the price back to $65. When the price finally closes above $65, the double bottom pattern is confirmed. A trader enters at $66, places a stop at $54, and targets $75 based on the pattern’s height.
This trade shows why the double bottom pattern is a reliable bullish reversal pattern in technical analysis in trading.
Confirming with Volume and Technical Indicators
Volume and momentum indicators can make your double bottom chart pattern trades even more reliable.
- Volume often drops on the second bottom, signalling seller exhaustion.
- A strong volume surge on the neckline breakout is a key bullish confirmation.
- RSI or MACD frequently show bullish divergence at the second bottom—price makes equal lows, but the indicator makes higher lows.
- Additional indicators like moving averages can provide extra support if the breakout happens near an important average.
Always remember, using confirmation increases your odds of success.
Advanced Double Bottom Trading Techniques
Want to trade like a pro? Here are strategies to maximise results with the double bottom pattern:
- Multi-timeframe analysis: If you spot a double bottom on the 4-hour and daily charts, the reversal is stronger.
- Retest entries: Sometimes after the breakout, price will pull back to test the neckline before moving higher. This retest can be a safer entry.
- Combining with other bullish reversal patterns: Look for candlestick signals like bullish engulfing at the second bottom for added conviction.
- Trendlines and Fibonacci: Use a confluence of support, resistance, and Fibonacci retracements to refine your entries and exits.
Common Mistakes to Avoid
Traders often fall into these traps:
- Jumping in before the breakout above the neckline. Always wait for confirmation.
- Ignoring volume or entering on a weak breakout.
- Using the double bottom pattern in sideways, choppy markets where reversals are less likely.
- Placing stops too close, causing premature exit on minor pullbacks.
- Forgetting to set a logical target based on the pattern’s height.
Learning from these mistakes will make your use of the double bottom chart pattern much more profitable.
Comparing the Double Bottom Pattern with Other Bullish Reversal Patterns
The double bottom pattern is a staple, but how does it stack up against other reversal chart patterns?
- It’s easier to spot and trade than the inverse head and shoulders, which has three troughs instead of two.
- It offers a straightforward entry, stop, and target—making it ideal for traders who like rules-based strategies.
- Unlike random “V” bottoms, the double bottom’s symmetry increases its reliability.
- In very volatile markets, combining double bottom patterns with candlestick or trendline analysis can filter out false signals.
Practical Tips for Mastering Double Bottom Patterns
- Backtest on historical charts to get comfortable recognising the pattern in different markets and timeframes.
- Use alerts or screeners to spot new setups automatically.
- Keep a journal. Log each trade, noting why you took it, your entry, stop, target, and the outcome.
- Study both successful and failed patterns to learn the nuances.
As with all technical analysis in trading, practice is the best teacher.
Frequently Asked Questions
Can the double bottom pattern fail?
Absolutely. No pattern is perfect. This is why risk management is crucial—use stops, confirm with volume, and never risk more than you can afford to lose.
Which timeframes work best?
While double bottoms can appear on all timeframes, the daily and four-hour charts offer the most reliable signals due to less market noise.
Does the pattern work in forex and crypto?
Yes. The double bottom pattern is universal and shows up in any liquid market.
Is it necessary to use volume and indicators?
Volume and indicators improve your win rate, but a clean double bottom pattern can still work on its own.
How close should the two bottoms be in price?
Ideally, within 1-3% of each other. If they are too far apart, the pattern is less reliable.
Double Bottom Pattern in the Real World: More Examples
Forex Example: EUR/USD
EUR/USD falls from 1.1500 to 1.1000 (first bottom), bounces to 1.1300 (neckline), drops again to 1.1020 (second bottom), and then rallies above 1.1300. A trader buys at 1.1310, sets a stop at 1.0980, and aims for 1.1600.
Crypto Example: Bitcoin
Bitcoin tumbles from $42,000 to $36,000 (first bottom), bounces to $39,000 (neckline), then tests $36,500 (second bottom). Price explodes above $39,000, confirming the double bottom pattern and signalling a move toward $42,000 and higher.
Stock Example: Tesla
Tesla stock drops from $300 to $200 (first bottom), bounces to $250 (neckline), dips again to $205 (second bottom), then rockets above $250, giving a signal to aim for $300 or more.
Double Bottom Pattern: Summary Table
| Feature | Details |
|---|---|
| Pattern Type | Bullish Reversal Pattern |
| Number of Lows | Two (similar price levels) |
| Entry Trigger | Breakout above neckline/resistance |
| Stop Loss | Just below the second bottom |
| Target | Height from bottoms to neckline, projected up |
| Confirmation | Volume surge, bullish RSI/MACD divergence |
| Best Timeframes | Daily, 4-hour, weekly |
| Markets | Stocks, Forex, Crypto, Commodities |
| Common Mistake | Entering before breakout or ignoring volume |
Action Plan: How to Use the Double Bottom Pattern
- Study past charts for classic double bottom examples.
- Practice identifying the pattern after strong downtrends.
- Use alerts to find new patterns in real time.
- Backtest different entry, stop, and target strategies to see what works best for you.
- Always wait for a confirmed breakout before trading.
- Use risk management—never risk more than 2% of your account per trade.

Final Thoughts:
The double bottom pattern is more than just a visual cue—it’s a proven bullish reversal pattern in technical analysis in trading. Its clear structure, logical psychology, and reliable signals make it an indispensable tool for both new and experienced traders. While no pattern works every time, the double bottom’s simplicity, transparency, and adaptability mean it will continue to be relevant in 2025 and beyond. If you want to improve your ability to spot trend reversals, manage risk, and build consistent profits, mastering the double bottom chart pattern is a smart move.
Start watching for double bottom patterns in your favourite markets today. The next big reversal could be one pattern away.
Read here to learn more about “Head and Shoulders Pattern: Proven Signals for Confident Trading“.

I’m Chaitali Sethi, a financial writer and market strategist focused on Forex trading, market behaviour, and trader psychology. I simplify complex market movements into clear, practical insights that help traders make better decisions and build a stronger trading mindset.