

In every financial market, traders are always looking for the first sign of a trend reversal. Catching these moments—when a rally exhausts and prices start tumbling—can mean the difference between big profits and painful losses. Among all reversal patterns, the double top is perhaps the most widely recognised and respected. Traders from Wall Street to retail forex forums rely on the double top pattern to provide early warnings of a bearish reversal signal. This pattern has stood the test of time for good reason. It combines simplicity, visual clarity, and reliable predictive power. For both newcomers and seasoned pros, understanding and using the double top is a skill that can deliver real trading results.
But what makes the double top pattern so special in technical analysis in trading? It’s not just about the “M” shape it forms on a chart. It’s about the psychology of buyers and sellers, the battle for market direction, and the transition from euphoria to caution. This guide will take you through every aspect of the double top chart pattern—from basics and real market examples to advanced trading strategies and the deeper reasons why it works. You’ll discover how to spot this pattern in any market, trade it with discipline, and avoid the classic mistakes that trap so many traders.
Understanding the Double Top
The double top is more than just a chart formation. It tells a story of shifting market dynamics. Imagine an asset in a strong uptrend. Buyers are confident, pushing prices higher. Eventually, price hits a peak where some traders take profits, causing a pullback. But optimism is still strong, and after a brief dip, the market rallies again, reaching for new highs.
Here’s where things get interesting. The second rally fails to break above the first peak. Suddenly, the optimism begins to fade. Sellers notice the lack of momentum. Buyers, seeing resistance, hesitate to enter at high prices. The market stalls, and as the price drifts down toward the previous pullback low (the neckline), tension builds. When the neckline finally breaks, a flood of selling can trigger, setting off a true bearish reversal signal. The double top pattern captures this entire shift, showing the transition from bullish enthusiasm to bearish control.
Technical analysis in trading values this psychological story. It’s not just lines on a chart—it’s about understanding who’s in control, when confidence fades, and how mass behaviour influences price.
The Structure of the Double Top Pattern
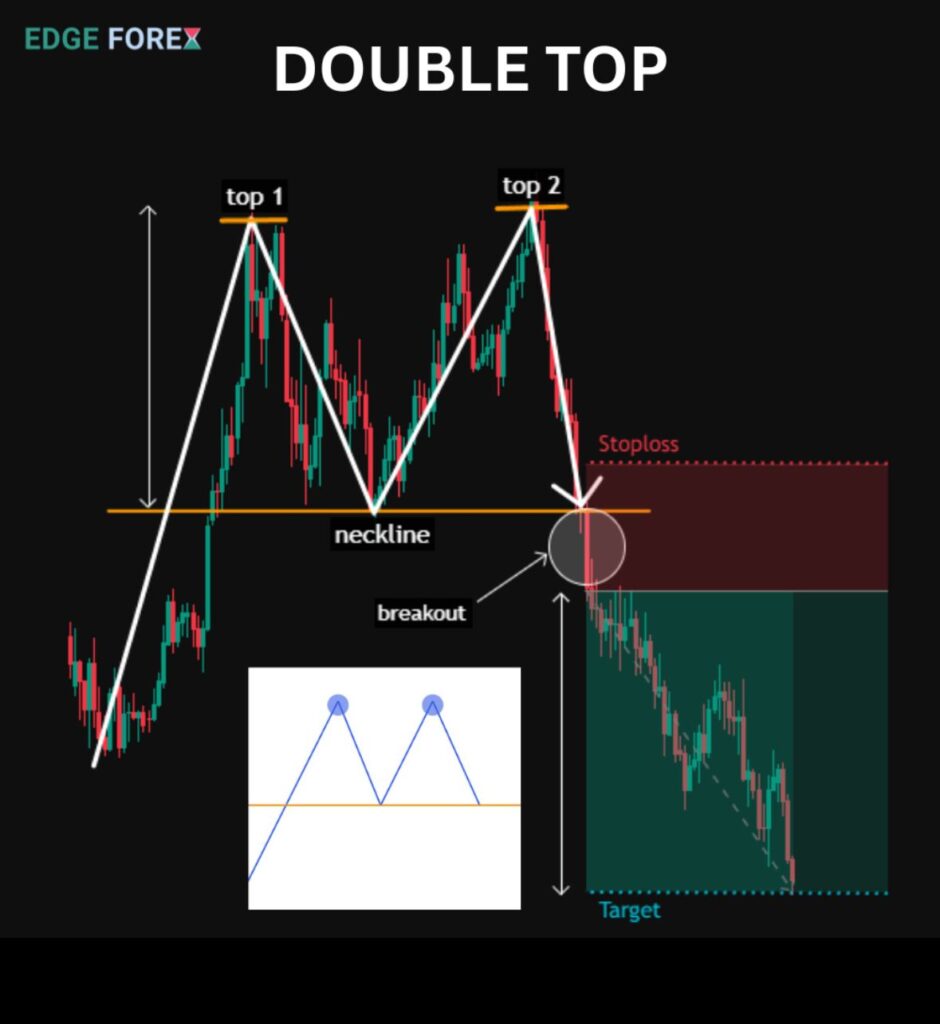
A classic double top chart pattern has clear visual markers:
- First, you need an existing uptrend, usually with steady buying and higher highs.
- Next comes the first top: price makes a new high, which is usually above recent resistance.
- After this peak, the market pulls back as profit-taking or light selling kicks in, forming a temporary support or neckline.
- The second rally is crucial. If the market rises again but fails to surpass the first top—stalling at a similar level—scepticism increases.
- The pattern completes when price falls back down and breaks below the neckline, confirming the bearish reversal signal.
What separates the double top from random chart noise is the symmetry and resistance at the two peaks. The neckline’s location is also critical. Many traders will not act until the price breaks and closes below this key level, as this signals the sellers are now in control.
Real Market Examples: Double Top Pattern in Action
Let’s bring this pattern to life with some real examples. In forex, the double top is common in major pairs. Imagine the GBP/USD surges from 1.2700 to 1.3200 over several weeks. After hitting resistance, it drops to 1.2950. Bulls try again, but the pair stalls at 1.3180, failing to break new ground. When GBP/USD closes below 1.2950, the double top pattern is triggered, and a wave of selling often follows. Smart traders who waited for this confirmation have a clear bearish reversal signal and can plan their trades accordingly.
The same logic applies to stocks. Suppose Tesla rises from $800 to $980, dips to $900, and then rallies again to $975 before fading. When the price falls back and closes below $900, the double top pattern flashes its warning. The sell-off can be fast and severe, especially if supported by high trading volume.
Even cryptocurrencies show these setups. During a strong bull run, Bitcoin can hit $70,000, drop to $64,000, then try again to break $70,000 but stall at $69,800. A close below $64,000 confirms the double top, often leading to sharp declines as traders react to the clear technical signal.
Why the Double Top Pattern Delivers a Reliable Bearish Reversal Signal
The double top isn’t just about pattern recognition; it’s about timing. Why does this structure work so often? The answer is rooted in crowd psychology and supply-demand shifts.
After a long rally, bullish traders are in control, and sentiment is sky-high. The first top is where early profit-takers start selling, creating a minor pullback. When price rallies again but fails at resistance, it signals that buyers are running out of steam. Sellers recognise this weakness, step up their efforts, and push prices lower. The neckline break is where technical traders join the move, confirming the bearish reversal signal.
Volume analysis often adds more confidence. If you see lower volume on the second peak and higher selling volume at the neckline break, the technical analysis in trading supports the validity of the pattern.
Key Criteria for a High-Quality Double Top Pattern
Not every “M” shape qualifies as a strong double top. Certain factors increase the reliability of the signal:
- The two tops should be at similar price levels, within a few percentage points.
- The pullback between tops (the valley) should be significant but not too shallow.
- Volume should ideally decrease on the second top and increase on the neckline break.
- The preceding trend should be clearly bullish; double tops after weak trends are less reliable.
- The neckline break should be clear and decisive, preferably with a strong close below support.
By following these guidelines, you can avoid many false signals and focus on the double top chart patterns that matter most.
Step-by-Step Guide: How to Identify and Confirm a Double Top
Spotting the double top in real time requires discipline and a keen eye for chart structure. Here’s a step-by-step approach:
- Scan for an established uptrend with clear, higher highs and higher lows.
- Mark the first peak—the highest price before the initial pullback.
- Watch for a valley as the asset retraces, typically finding support at a new low.
- Monitor the rally for a second attempt at a new high. The pattern becomes likely if this rally stalls near the first peak.
- Draw a horizontal line at the neckline, the lowest point between the two tops.
- Wait for the price to break and close below the neckline. A decisive close, ideally on increased volume, provides the confirmation you need.
Remember, patience is key. Many failed trades come from acting before the breakdown is confirmed. Let the market prove the pattern before you risk your capital.
Trading the Double Top: Entry, Stop-Loss, and Profit Targets
Once you have a confirmed double top, how should you actually trade it? A disciplined approach makes all the difference.
Entry Point:
Most traders enter a short position when the price closes below the neckline. In volatile markets, some wait for a retest of the neckline from below, which can provide an even lower-risk entry.
Stop-Loss Placement:
Place your stop-loss just above the second top, or above the most recent swing high. This protects you if the market unexpectedly rallies and invalidates the pattern.
Profit Target:
To project a target, measure the distance from the tops to the neckline. Subtract that amount from the neckline for your target price. For example, if the tops are at $100 and the neckline is at $90, the profit target would be $80. This classic approach gives you a logical exit point based on the structure of the double top chart pattern.
Risk Management:
As with any technical analysis in trading, risk control is essential. Never risk more than you can afford to lose. Many successful traders keep risk per trade at 1–2% of their account balance.
Advanced Double Top Trading Strategies
While the basic approach is powerful, advanced traders use several techniques to increase the odds of success with the double top pattern.
One method is to combine the double top with momentum indicators. For example, if the RSI shows bearish divergence (the second top forms with a lower RSI reading), it suggests waning buying power. MACD crossovers or histogram declines at the second top offer similar insights.
Another strategy is to look for confirmation on multiple timeframes. If you spot a double top on the four-hour chart and see supporting reversal signals on the daily chart, the setup is generally more robust. This multi-timeframe approach can filter out noise and help you focus on higher-probability trades.
Pattern clusters are another powerful tool. When a double top forms in conjunction with other bearish signals—like a head and shoulders top, resistance at a major round number, or a long-term trendline break—the odds of a successful reversal increase dramatically.
Volume analysis should not be overlooked. If the second top forms on noticeably lower volume and the neckline break comes with a surge in selling volume, technical analysis in trading is heavily weighted in favour of the bears.
The Double Top in Different Markets: Forex, Stocks, and Crypto
The double top chart pattern isn’t restricted to any single market. It’s a universal structure found in forex, equities, commodities, and even cryptocurrencies.
In forex, the double top frequently appears at the end of extended bull runs. Major pairs like EUR/USD or GBP/JPY often trace double tops before trend reversals, especially around key economic events or central bank announcements.
In stocks, double tops are common at market tops or near all-time highs. When a popular stock stalls at resistance twice and fails to push higher, watch for a breakdown, as institutional traders often use these signals to reduce risk or take profits.
Cryptocurrencies provide plenty of double top opportunities due to their volatility. When Bitcoin or Ethereum forms a double top after a parabolic move, price often drops sharply as traders race to lock in gains.
Commodities like gold and oil also display double top patterns, especially when macroeconomic shifts or geopolitical tensions spark rapid rallies followed by exhaustion.
Double Top vs. Double Bottom: Flipping the Script
It’s important to understand the double top pattern’s mirror image—the double bottom. While double tops warn of bearish reversals after uptrends, double bottoms alert traders to bullish reversals after downtrends. The structure is the same, but the psychology is flipped. Where double tops signal a transition from greed to fear, double bottoms highlight the shift from fear to renewed confidence. Mastering both patterns gives you a powerful edge in technical analysis in trading.
Common Pitfalls and How to Avoid Them
Despite its power, the double top can lead to mistakes if not approached with discipline. Acting before confirmation is a common error. Always wait for a clear neckline break and close before entering a trade. Another mistake is ignoring the broader market context. If a double top forms during an overall bullish environment with strong fundamentals, the pattern might fail.
Overtrading double tops in choppy or sideways markets is also risky. The pattern is most reliable after strong, trending moves—not in low-volatility environments. Ignoring volume analysis is another pitfall. Weak volume on the neckline break means the reversal signal may not have enough strength.
Lastly, risk management is non-negotiable. Using stop-loss orders and keeping position sizes reasonable ensures that even failed patterns won’t wipe out your trading account.
When Double Top Patterns Fail: Understanding False Breakouts
No pattern is perfect, and the double top is no exception. Sometimes, price breaks the neckline only to snap back above it in a bear trap, forcing shorts to cover and fuelling a rally. This usually happens when overall market sentiment remains bullish or when the breakdown occurs on weak volume. The best defence is patience. Wait for strong confirmation, use trailing stops, and always be ready to exit if the market invalidates your setup.
Double Top Pattern and Modern Trading Technology
Today’s traders have access to advanced charting platforms, automated alerts, and AI-powered scanners that make identifying the double top easier than ever. Many trading platforms allow you to set alerts for price action at key levels, so you never miss a potential reversal. Some traders even use algorithmic strategies to scan hundreds of assets for double top chart patterns, combining human insight with machine precision.
Backtesting tools let you review how the double top pattern has performed in various markets and timeframes. This data-driven approach can help you refine your strategy and understand the conditions where the pattern works best.
Integrating Double Top Patterns with Other Trading Systems
Savvy traders rarely rely on a single pattern. They often integrate the double top with trend-following systems, mean reversion strategies, or news-based trades. For example, if a double top forms right after a disappointing earnings report or central bank statement, the pattern’s signal can be even more powerful.
Some traders use the double top pattern as an early exit from winning trades. If you are long and spot a potential double top forming, tightening stops or scaling out of your position can help lock in profits before a reversal.
Combining Double Top Patterns with Fundamental Analysis
While the double top is a technical pattern, combining it with fundamental analysis can increase reliability. For example, if an asset forms a double top right as negative economic news emerges or company earnings disappoint, the reversal signal is more likely to succeed.
During major macroeconomic events, double tops in currencies or commodities can signal the start of larger trends. This blending of technical analysis in trading with fundamental awareness is how many top traders increase their success rate.
The Double Top and Risk Management in Today’s Markets
The core of successful double top trading is risk management. Even the most beautiful pattern can fail when markets are unpredictable. Always use stop-loss orders and position sizing, and if possible, hedge your trades with options or correlated assets.
Many experienced traders recommend a tiered exit strategy—taking some profits at the first target and trailing stops for the rest, allowing you to capture larger moves when the bearish reversal signal is particularly strong.
Final Thoughts: Mastering the Double Top for Smarter, Safer Trades
The double top pattern is not just a technical shape—it’s a reflection of market psychology, crowd behaviour, and the constant tug-of-war between buyers and sellers. Its staying power comes from its ability to capture these dynamics in a simple, visual format that any trader can use.
If you are serious about technical analysis in trading, the double top should be in your toolkit. Use it to spot early warning signs of trend reversals, time your entries and exits, and stay ahead of the crowd. Combine it with volume analysis, momentum indicators, and risk management principles, and you have a formula for consistent success.
Keep in mind that the best traders are not just pattern followers—they’re students of the market, always learning and adapting. Treat each double top as a lesson in crowd psychology, validate your signals with sound analysis, and manage your risk like a professional.
The double top pattern has guided generations of traders through volatile markets and trend reversals. With the right approach, it can do the same for you—helping you spot opportunities, avoid pitfalls, and trade with greater confidence.
Read here to learn more about “Double Bottom Pattern: Proven Signal for Bullish Reversals‘

I’m Chaitali Sethi, a financial writer and market strategist focused on Forex trading, market behaviour, and trader psychology. I simplify complex market movements into clear, practical insights that help traders make better decisions and build a stronger trading mindset.