

In financial markets, trends are the heartbeat of price movement. The most talked-about trends are often bullish, but knowing how to trade a downtrend is just as important, if not more so. A downtrend occurs when prices move lower over time, forming a staircase of falling peaks and valleys. This pattern signals that sellers have the upper hand and market sentiment is negative. Recognising a downtrend early can help traders avoid losses, identify bearish reversal signals, and capitalise on opportunities. Mastering the downtrend pattern is a key part of technical analysis in trading.
Understanding the Downtrend Pattern
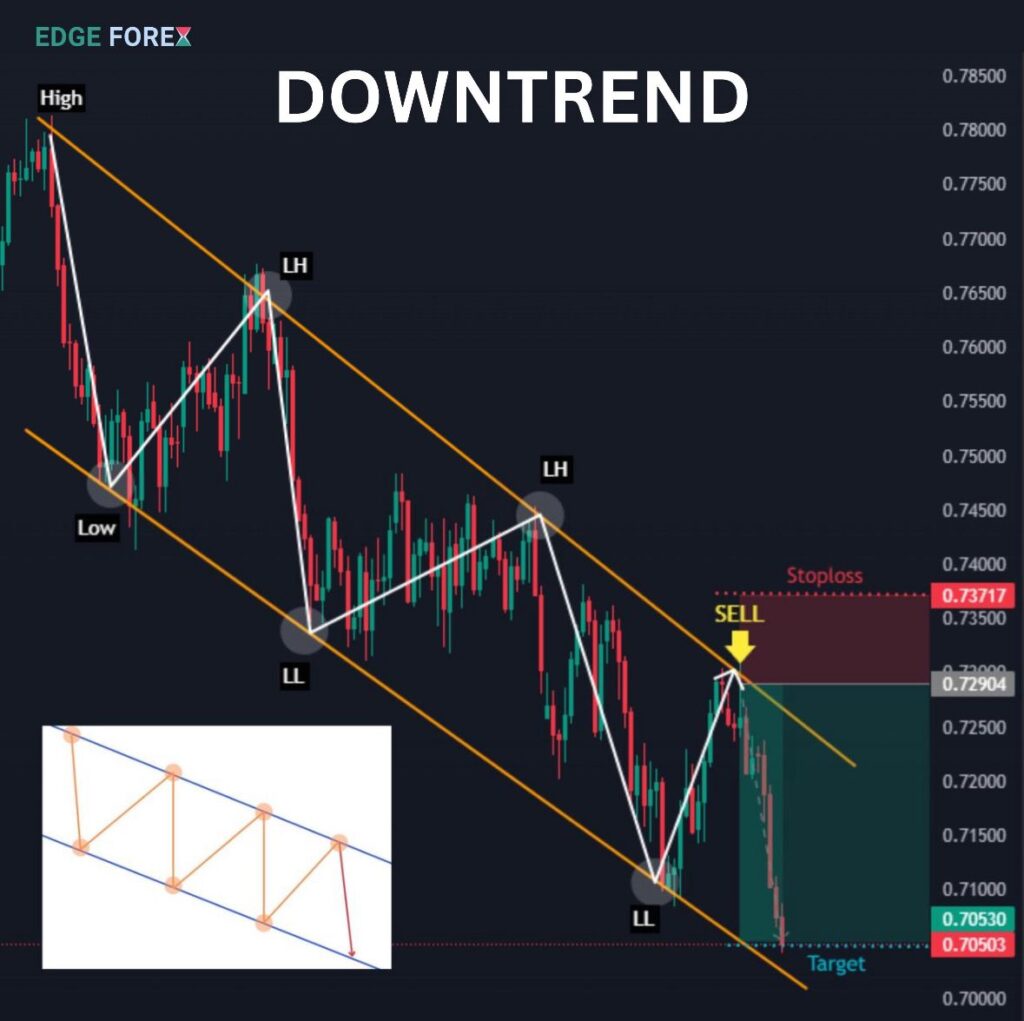
A downtrend pattern is defined by a series of lower highs and lower lows on the price chart. Every rally fails to exceed the last peak, and each dip falls below the previous trough. Traders look for these clues to determine when to avoid long trades and focus on trading downtrend strategies instead. Spotting a downtrend is the foundation of successful bearish trading.
Some characteristics of a strong downtrend pattern:
- Each peak on the chart is lower than the last.
- Each trough breaks the previous support level.
- The slope of the price line is consistently downward.
- Technical analysis in trading shows increasing selling pressure.
For example, imagine a stock dropping from $100 to $85, bouncing to $92, then falling again to $80. Each time the price rallies, it cannot break above the prior high, and each decline carves out a fresh low. This sequence is a classic downtrend pattern.

Key Technical Analysis in Trading Downtrends
Technical analysis in trading is the process of using historical price and volume data to forecast future price movements. In a downtrend, traders rely on chart patterns, indicators, and momentum studies to confirm bearish reversal signals. Successful trading downtrend strategies depend on clear technical analysis and strict risk management.
Popular technical tools for spotting a downtrend include:
- Moving averages (50-day, 100-day, 200-day)
- Trendlines connecting lower highs
- Volume analysis for confirmation
- Momentum oscillators such as RSI and MACD
Let’s say you notice a currency pair failing to climb above its 50-day moving average. At the same time, volume rises on days when the price falls, and the RSI remains below 40. These technical indicators, combined, paint a convincing picture of a prevailing downtrend.
Classic Downtrend Chart Patterns and Bearish Reversal Signals
Chart patterns are essential tools in technical analysis in trading. They help traders spot not just the trend but also signs of when a downtrend may accelerate or reverse.
Some common downtrend patterns and bearish reversal signals include:
- Descending Triangle: Features a flat support line and a series of lower highs, often breaking down for a sharp sell-off.
- Bear Flag: Appears as a short pause or rally during a larger downtrend, followed by continued selling.
- Death Cross: Occurs when a short-term moving average crosses below a longer-term moving average.
- Head and Shoulders Top: Signals a potential long-term downtrend when the neckline is broken.
A real-world example is the S&P 500’s decline in early 2020. Repeated attempts to rally failed at lower levels, and a death cross reinforced the bearish sentiment. Each failed bounce created new opportunities for trading downtrend strategies.
How to Spot the Beginning of a Downtrend
Identifying the start of a downtrend can be challenging, especially in volatile markets. However, by focusing on a few proven techniques in technical analysis in trading, traders can get ahead of the curve.
Watch for these signals:
- A failed breakout at previous highs followed by a sharp sell-off.
- Support levels breaking with increased volume.
- Momentum indicators showing negative divergence.
For example, if a stock repeatedly fails to close above its resistance and then quickly breaks support, that’s an early sign of a downtrend. Combine this with a bearish reversal signal from an RSI drop, and you have a strong case for a new bearish trend.
Examples of Downtrend Patterns in Real Markets
Downtrend patterns can appear in any asset class: stocks, forex, commodities, and cryptocurrencies. Real-world examples make the concept easy to understand.
- Stocks: In 2022, Meta Platforms (formerly Facebook) entered a clear downtrend after disappointing earnings. Each rally stalled at a lower level, and every sell-off drove the stock to new lows.
- Forex: EUR/USD showed a textbook downtrend throughout much of 2022. Each bounce was met with heavy selling, confirming the downtrend pattern.
- Commodities: Crude oil sometimes enters downtrends when global supply outpaces demand. Lower highs and lower lows become easy to spot on the price chart.
Traders who used technical analysis in trading, such as moving averages and volume, could identify these downtrends early and adjust their strategies.

Trading Downtrend Strategies: Practical Approaches
When trading a downtrend, the goal is to profit from falling prices while minimising risk. Several trading downtrend strategies work well for different market conditions.
- Short Selling:
- Sell borrowed shares or contracts, aiming to buy back at a lower price.
- Enter after a bearish reversal signal, such as a failed rally or support break.
- Example: After a stock breaks below its 50-day moving average, short sell and place a stop above the previous high.
- Put Options:
- Buy put options to profit from further declines while capping your risk.
- Options offer leverage and limited loss potential.
- Example: Buy a put on an index after spotting a death cross.
- Trailing Stops:
- Use trailing stop-loss orders to lock in profits as the downtrend continues.
- Adjust stops above new lower highs.
- Example: In a persistent downtrend, move your stop with each bounce to protect your gains.
- Trendline Break Confirmation:
- Wait for the price to retest and fail at a descending trendline before entering short trades.
- Example: A forex pair bounces to its trendline, stalls, and then resumes the downtrend.
- Using Technical Indicators:
- Combine RSI, MACD, and moving averages to confirm the strength of a downtrend.
- Look for bearish reversal signals from multiple indicators.
Key pointers for trading downtrend strategies:
- Stick to the trend. Do not fight the momentum.
- Always use stop-loss orders above resistance.
- Only add to positions when the trend is confirmed.
- Monitor volume for clues on selling pressure.
- Avoid counter-trend trades unless you see a clear reversal pattern.
Risk Management in Downtrend Trading
Managing risk is the difference between a winning trader and a blown account. Downtrends can accelerate quickly, so every trade needs a plan. Technical analysis in trading offers tools for risk management, such as support and resistance zones and volatility-based stops.
Follow these rules:
- Never risk more than a small percentage of your capital per trade.
- Set stops at logical chart points, like above a swing high.
- Don’t double down on a losing trade.
- Reduce position size in high-volatility environments.
If you short a stock after a bearish reversal signal, make sure your stop is placed just above the failed rally. This way, you control losses if the market turns against you.
Common Mistakes When Trading Downtrends
Trading downtrend strategies can be highly profitable, but common mistakes can lead to losses. Avoiding these errors is vital for consistent results.
- Chasing price after a big move: Wait for a pullback or retest before entering.
- Ignoring volume: Low-volume breakdowns often lack follow-through.
- Holding trades too long: Take profits when the trend weakens or reversal signals appear.
- Neglecting technical analysis in trading: Always use indicators to confirm setups.
For example, many traders get trapped by shorting right after a sharp drop, only to watch the price bounce and hit their stop. Patience and discipline set the winners apart from the rest.
When Does a Downtrend End?
All downtrends eventually end, but the reversal is not always obvious. Technical analysis in trading can help spot potential bottoms, but traders should wait for clear evidence.
Signs of a downtrend ending:
- Price forms a higher low and breaks above resistance.
- Bullish reversal signals from patterns like double bottom or inverse head and shoulders.
- Volume increases on rallies rather than sell-offs.
- Momentum indicators like RSI start to rise above 50.
For instance, after months of lower lows, a stock forms a double bottom pattern and surges above its trendline on heavy volume. This is a classic bullish reversal signal, suggesting the downtrend pattern is finished.
Example: Downtrend Pattern in Crypto
In 2018, Bitcoin’s long decline from $19,000 to $3,000 illustrated the power of the downtrend pattern. Every rally failed to overcome resistance, and lower lows were the norm. Traders who followed the trend, used technical analysis in trading, and waited for bullish reversal signals avoided major losses and captured profitable short opportunities.
Practical Checklist for Trading Downtrend Patterns
- Identify the trend with lower highs and lower lows.
- Use technical analysis in trading for confirmation.
- Enter trades only after a clear bearish reversal signal.
- Place stops above resistance or swing highs.
- Lock in profits with trailing stops.
- Watch volume for extra conviction.
- Do not trade against the trend without a confirmed reversal.

Final Thoughts: Trading Bearish Markets with Confidence
A downtrend is not just a series of falling prices—it is a signal of negative sentiment, a sign that sellers are in control, and an opportunity for disciplined traders. By focusing on the downtrend pattern, relying on technical analysis in trading, and using proven trading downtrend strategies, you can thrive in bearish markets.
Whether you trade stocks, forex, commodities, or crypto, the downtrend pattern offers clear, repeatable setups. Follow the checklist, stay disciplined, and always let the chart guide your decisions. Great traders know that the trend is their friend, even when the market moves down.
Read here to learn more about “Double Bottom Pattern: Proven Signal for Bullish Reversals“.

I’m Chaitali Sethi, a financial writer and market strategist focused on Forex trading, market behaviour, and trader psychology. I simplify complex market movements into clear, practical insights that help traders make better decisions and build a stronger trading mindset.