

If you’ve ever watched a trending market suddenly lose momentum and reverse, you might have seen the head and shoulders pattern in action—sometimes without even realising it. This classic pattern is more than just a chart shape. It’s a real-time signal of shifting trader psychology, and it’s helped generations of traders spot major turning points long before headlines catch up.
What’s special about the head and shoulders pattern? Unlike so many confusing trading indicators, this one stands out for its clear, visual structure and its uncanny ability to flag reversals just as bullish energy is running out of steam. In this article, you’ll learn how to confidently recognise the head and shoulders pattern, why it works across markets and timeframes, how to trade it step by step, and how to avoid common mistakes. Whether you’re trading forex, stocks, crypto, or commodities, this reversal chart pattern can become a true edge in your technical analysis toolkit.
What Is the Head and Shoulders Pattern?
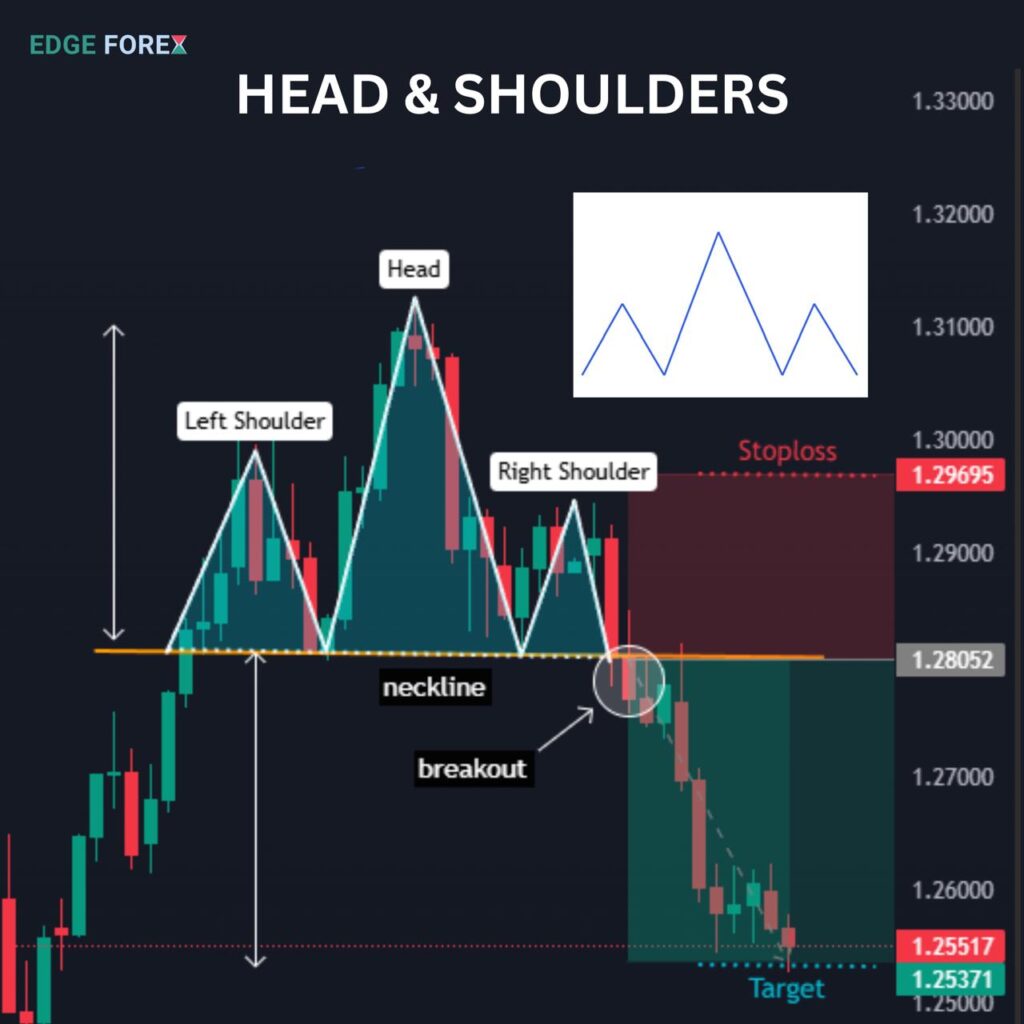
Think of the head and shoulders pattern as a warning flare from the market. When an uptrend starts to weaken, prices form three distinct peaks: the first peak is the left shoulder, the middle and highest is the head, and the third is the right shoulder, usually lower than the head. Beneath these, you’ll spot two valleys, and if you connect them with a line (called the neckline), you have the full pattern.
When the price breaks below that neckline, it’s like the market announcing, “The trend has changed—get ready.” This is what makes the head and shoulders pattern a favourite among reversal chart patterns in technical analysis in trading.
Quick checklist:
- The trend before the pattern should be upward.
- You need three clear peaks (shoulders on each side, head in the centre).
- The neckline connects the two valleys between the peaks.
- The pattern isn’t valid until the neckline is broken.

Why Does the Head and Shoulders Pattern Work?
This pattern works because it’s a visual story of how buyers and sellers fight for control:
- The left shoulder: Buyers still have control, but some take profit, leading to a pullback.
- The head: Bulls make one last big push; new highs excite everyone, but eventually, they run out of energy.
- The right shoulder: Sellers begin to step in, and buyers can’t push prices higher than the head. That’s a classic sign of exhaustion.
- The neckline: When price breaks this level, sellers are in charge—and a new downtrend often begins.
You can find this same psychological tug-of-war in almost every liquid market. That’s why the head and shoulders pattern is one of the most respected reversal chart patterns in technical analysis in trading.
How to Spot the Head and Shoulders Pattern: A Practical Guide
You don’t need to be a chart genius to find this pattern, but attention to detail helps. Here’s a simple approach:
- Look for a strong uptrend. This pattern is a reversal, not a continuation signal.
- Identify three peaks: The middle peak must be higher than both shoulders.
- Draw the neckline: Connect the lowest points between the left shoulder/head and the head/right shoulder.
- Wait for a break: Only act once the price closes below the neckline.
Tip: Patterns don’t need to be perfect. Shoulders can be uneven. Sometimes the neckline slopes. What matters most is the overall shape and the break.
How to Trade the Head and Shoulders Pattern: Step-by-Step
Ready to move from spotting to trading? Here’s how most experienced traders approach it:
- Pattern confirmation: Wait until the right shoulder has formed and the neckline is drawn.
- Entry: Sell (go short) when the price closes below the neckline. Conservative traders might wait for a retest of the neckline from below.
- Stop loss: Place your stop just above the right shoulder to protect against failed breakouts.
- Profit target: Measure the distance from the top of the head to the neckline. Subtract that from your entry for a realistic price target.
- Trade management: Move your stop to break even once the price moves in your favour. Consider taking partial profits as the price approaches support.
Example:
Imagine EUR/USD trends up for weeks. It forms a left shoulder at 1.10, a head at 1.14, and a right shoulder at 1.11. The neckline runs from 1.09 to 1.10. Once the price closes below 1.09, you short, stop at 1.11, and target around 1.05.

Inverse Head and Shoulders: Catching Bullish Reversals
Don’t forget—this pattern has a bullish twin! The inverse head and shoulders form at the end of a downtrend:
- Three troughs: the head is lowest, and the shoulders on each side are higher.
- The neckline connects the peaks between the troughs.
- Once price breaks above the neckline, buyers take control, signalling a new uptrend.
Example:
Bitcoin falls from $44,000 to $38,000 (left shoulder), bounces to $41,000, dips to $36,000 (head), rebounds to $40,000, dips to $38,500 (right shoulder), then rips above $41,000 (neckline). That breakout is your long signal.
How Volume and Indicators Confirm the Pattern
Great traders always want a second opinion. Here’s how you can use other tools for confirmation:
- Volume: Often drops as the right shoulder forms. A volume spike on the neckline break adds confidence.
- RSI or MACD: Bearish divergence (lower highs in the indicator, higher highs in price) during the pattern strengthens your case.
- Moving averages: If the neckline break lines up with a moving average, it’s even more powerful.
Remember, combining reversal chart patterns with technical analysis in trading leads to more reliable trades.
Common Mistakes to Avoid
Even seasoned traders trip up with this pattern. Here are pitfalls to sidestep:
- Jumping the gun: Don’t enter before a confirmed neckline break.
- Ignoring volume: A weak neckline break with low volume is often a trap.
- Trading choppy markets: The pattern works best after clear trends, not sideways movement.
- Forgetting stop losses: Even the best setups can fail, especially in volatile assets.
Case Studies: Real-World Examples
Stock Market: Apple
Apple’s stock rallies from $120 to $150 (left shoulder), dips, surges to $160 (head), dips again, rises to $148 (right shoulder), then collapses below $140 (neckline). The break signals a possible trend reversal. Traders are short and target $130.
Crypto: Ethereum
ETH tumbles from $3,200 to $2,800 (left shoulder), bounces, sinks to $2,600 (head), rebounds, dips to $2,750 (right shoulder), then surges above $2,950 (neckline). A classic inverse head and shoulders—bulls get in on the breakout.
Head and Shoulders vs. Other Reversal Chart Patterns
How does this pattern stack up against others? Unlike double tops or bottoms, which rely on two peaks or troughs, the head and shoulders pattern provides a clear, three-part structure and a straightforward method for setting stops and targets. Wedge patterns and triangles can be more subjective and harder for new traders to master.
Advanced Tactics and Tips
- Retest entries: Sometimes price will break the neckline, pop back to retest it, then continue the move. These retests can be low-risk entries.
- Multi-timeframe analysis: If you see the pattern forming on both the 4-hour and daily charts, its power increases.
- Combine with trendlines and moving averages: The more “confluence” you have, the stronger the setup.
- Journal your trades: Note how well each setup works. Over time, you’ll spot which tweaks suit your style.
Frequently Asked Questions
Q: Can the head and shoulders pattern fail?
A: Yes, especially in news-driven or illiquid markets. That’s why stops and confirmation matter.
Q: What timeframe works best?
A: Daily and 4-hour charts offer the most reliable signals, but the pattern can appear on any timeframe.
Q: Should I always wait for a candle close?
A: Yes, for best results. Entering on a wick or before a close risks falling for fakeouts.
The Big Picture: Why This Pattern Endures
If you look through old charts, you’ll spot head and shoulders patterns going back decades. They show up in forex, stocks, commodities, and crypto alike. The reason is simple: they map real human behaviour—excitement, greed, doubt, and fear—directly onto your chart. That’s why technical analysis in trading, especially using reversal chart patterns, still works in the algorithm age.
Key Takeaways
- The head and shoulders pattern is one of the most reliable reversal chart patterns in trading.
- Look for three peaks and a neckline, and wait for a confirmed break before trading.
- Always use stops and reasonable targets.
- Combine with volume, indicators, and other forms of technical analysis for the best results.
- Practice spotting the pattern in different markets and timeframes to build skill and confidence.

Ready to Try It?
Pull up a chart, see if you can spot a head and shoulders pattern, and walk through these steps before ever risking real money. Use demo accounts or backtest past data. With practice, you’ll spot market turning points before the crowd, helping you trade with more clarity, less stress, and greater consistency.
The head and shoulders pattern is more than just a chart curiosity—it’s a proven, practical tool for confident trading in any market.
Read here to learn more about “Risk-to-Reward Ratio in Forex Trading: A Key to Smarter Profits“

I’m Chaitali Sethi, a financial writer and market strategist focused on Forex trading, market behaviour, and trader psychology. I simplify complex market movements into clear, practical insights that help traders make better decisions and build a stronger trading mindset.