

The Relative Volume Indicator is a vital trading tool that measures how active a market is compared to its historical average. It helps traders understand when market participation increases or fades, giving them a sharper sense of timing and conviction. In modern forex and stock trading, knowing how to interpret volume accurately is often the difference between catching a move early and reacting too late.
This indicator compares the current trading volume to an average over a set number of past periods. A higher ratio means current activity is stronger than usual, signaling that traders are highly engaged. When combined with trading volume analysis, the Relative Volume Indicator becomes a guide for identifying breakouts, reversals, and entry zones supported by strong participation.
Learning how to use relative volume in trading also allows you to filter false signals. Instead of reacting to every price movement, you can confirm whether the market truly supports that direction. As algorithmic systems dominate markets in 2025, the ability to read volume-based trading signals has become an essential skill for human traders seeking better market timing.
Understanding What the Relative Volume Indicator Measures
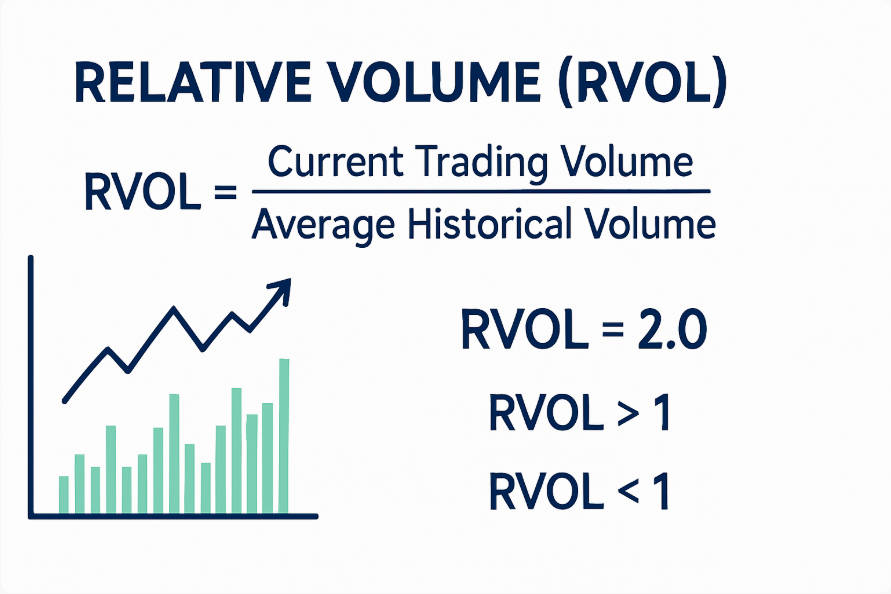
At its core, the Relative Volume Indicator compares current volume to the average volume over a chosen period—usually 10, 20, or 50 sessions. The calculation is simple:
Relative Volume = Current Volume ÷ Average Volume
If today’s trading volume in EUR/USD is 1.8 million units, and its 20-day average is 900,000, the Relative Volume equals 2.0. This shows the pair is trading with double its normal participation level.
A relative volume above 1.5 usually signals elevated interest, while readings beyond 2.5 often accompany major breakouts. Traders track these changes to gauge whether the market is quiet, neutral, or energized.
The indicator’s greatest advantage is clarity. Unlike complex oscillators, it reflects pure participation—how many traders are active and how strongly they support the price direction. Through consistent trading volume analysis, traders can spot accumulation or distribution phases and prepare before visible breakouts occur.

Why Relative Volume Matters for Better Market Timing
Price action tells only half the story. Volume explains the conviction behind that movement. A sharp price increase on low relative volume might indicate temporary speculation, while the same move with high relative volume confirms strong buyer interest.
This relationship makes the indicator powerful for timing entries and exits. When volume expands during breakouts, traders can act with confidence. When it shrinks, caution is warranted. For example, if GBP/USD breaks above a resistance level on low relative volume, the move might fade quickly. But if the Relative Volume Indicator rises above 2.0 at that moment, the breakout is likely genuine.
In forex, where liquidity is constant, even slight shifts in relative volume can reveal institutional behavior. Knowing how to use relative volume in trading ensures you trade with participation, not against it. For swing traders and day traders alike, volume confirmation acts as a timing compass—revealing when the crowd truly commits.
How to Use Relative Volume in Trading
Using the Relative Volume Indicator effectively requires both observation and structure. Here’s how traders apply it in real scenarios:
- Confirm Breakouts:
When the price crosses a major resistance level, check whether relative volume exceeds 1.5. A reading that high signals wide participation and a higher probability of continuation. - Identify Reversals:
Spikes in relative volume after a long trend may indicate exhaustion. For instance, when an uptrend stalls and volume surges, sellers might be stepping in. - Validate Chart Patterns:
Patterns such as triangles or flags are more trustworthy when accompanied by rising relative volume. - Track Institutional Orders:
Sudden Relative Volume increases during quiet sessions can reflect large institutional entries.
Incorporating these steps into a clear relative volume strategy turns raw data into decision-ready insights. Volume-based trading signals derived this way improve precision and remove emotional bias.
Building a Reliable Relative Volume Strategy
A complete relative volume strategy involves multiple stages: observation, confirmation, and risk control. The aim is to make data-driven choices instead of reacting impulsively.
- Set an Average Volume Benchmark: Use 20 to 50 sessions to calculate the baseline.
- Mark Key Thresholds: Readings above 1.5 show strength; above 2.0 show significant conviction.
- Add a Technical Filter: Pair the indicator with RSI, moving averages, or MACD.
- Confirm with Price Action: Enter trades only when both volume and structure agree.
- Review Regularly: Track performance weekly to refine thresholds.
A disciplined approach ensures the Relative Volume Indicator supports your decisions instead of overwhelming them. When integrated into trading volume analysis, this strategy offers clarity during volatile markets and confidence during uncertain sessions.

Trading Volume Analysis and Market Context
Trading volume analysis goes beyond counting transactions—it reveals intent. Rising volume confirms belief in a trend; falling volume signals hesitation. By studying relative volume in context, traders can interpret whether price movements are driven by conviction or noise.
For instance, during a major economic announcement, high relative volume paired with a strong directional candle confirms widespread engagement. When volume remains flat, reactions might be speculative or short-lived.
In 2025’s fast-moving markets, professional traders rely on such insights to decide whether to follow momentum or stay out. Volume analysis also reveals hidden opportunities: when relative volume begins rising in a consolidating asset, it often hints at a pending breakout. Recognizing these early shifts helps traders enter before the crowd.
Accurate trading volume analysis transforms the Relative Volume Indicator from a measurement tool into a predictive advantage.
Volume-Based Trading Signals Explained
Volume-based trading signals arise when changes in relative volume align with price movement. These signals are crucial for confirming momentum or spotting weakness early.
Examples include:
- Breakout Confirmation: A breakout supported by relative volume above 2.0 shows genuine strength.
- False Break Detection: If volume remains below 1.0 during a breakout, the move may reverse soon.
- Trend Continuation: Sustained relative volume between 1.5 and 2.5 supports ongoing momentum.
- Reversal Setup: Extreme volume spikes at the end of trends often indicate exhaustion.
When used properly, these signals prevent emotional entries and improve the accuracy of your Relative Volume strategy. Each reading should be interpreted in context—no indicator works in isolation. Consistent monitoring of volume-based trading signals helps traders distinguish between strong and weak setups.
Example: Relative Volume in a Real Forex Scenario
Consider EUR/USD trading near 1.0930. The 20-day average daily volume is 1.1 million lots. Suddenly, during a European Central Bank policy update, trading volume hits 2.5 million. The Relative Volume Indicator reads 2.27.
This surge coincides with a sharp price breakout toward 1.1000. The strong volume reading confirms institutional participation rather than retail speculation. Traders following the indicator can confidently enter at 1.0940, knowing the move is backed by momentum.
As volatility subsides, relative volume returns toward normal, signaling the best time to scale out. This real-world case illustrates how to use relative volume in trading for better entries and timely exits. When combined with stop-loss discipline, it becomes a foundation for consistent performance.
How Relative Volume Differs Across Markets
The Relative Volume Indicator adapts well to multiple markets, though its readings vary.
- Stocks: Spikes above 3.0 often indicate major institutional activity or earnings releases.
- Forex: Readings between 1.5 and 2.0 show significant short-term participation due to high baseline liquidity.
- Crypto: Relative volume swings can be extreme since participation depends on sentiment and social trends.
Traders must interpret readings relative to each market’s structure. In forex, a modest rise may signal strong participation, while in stocks the same value might seem average. Adjusting interpretation ensures accurate application of trading volume analysis. Regardless of the market, consistent monitoring of relative volume helps identify key moments of institutional engagement.
Best Timeframes and Platforms for Relative Volume Analysis
The Relative Volume Indicator functions across all timeframes. Choosing the right one depends on your trading style:
- Scalpers: Prefer 1-5-minute charts to catch quick bursts of liquidity.
- Day Traders: Use 15-60-minute intervals to match session patterns.
- Swing Traders: Rely on 4-hour or daily charts to evaluate broader participation.
Platforms like TradingView, MetaTrader 5, and NinjaTrader offer customizable Relative Volume tools. Some now include AI-enhanced adaptive averages that update automatically to reflect changing market behavior.
Using these platforms, traders can set volume alerts that trigger when readings cross specific thresholds. Consistent analysis on multiple timeframes helps identify when participation aligns across sessions, strengthening confidence in every trade setup.
Advanced Relative Volume Strategy for 2025
Markets today operate at record speed, influenced by automation and institutional algorithms. A modern relative volume strategy must adapt to this environment. Here’s an advanced method:
- Spot Low-Activity Phases: When Relative Volume drops below 0.8, prepare for a potential volatility expansion.
- Watch for Pre-Breakout Rises: Gradual increases toward 1.3–1.5 often precede structural shifts.
- Confirm Trend Direction: Enter when relative volume exceeds 1.6 alongside a price structure break.
- Manage Risk Dynamically: Exit when relative volume falls back below 1.0, signaling fading strength.
This approach merges structure and participation. It focuses on precision rather than prediction. Combining relative volume with volume-based trading signals from RSI or MACD strengthens confirmation. Over time, traders develop intuition for recognizing participation surges that lead to high-probability opportunities.
Case Study: Relative Volume During Major News Events
During the March 2025 U.S. Non-Farm Payroll release, USD/JPY experienced a 90-pip surge within five minutes. Prior to the data, Relative Volume remained below 1.0. Immediately after the release, it spiked to 3.4, confirming heavy market participation.
Traders who monitored this shift reacted quickly and captured the move from 146.70 to 147.60 before volatility cooled. Those relying on lagging indicators reacted later and entered at poor prices.
This case shows how critical the Relative Volume Indicator is during macro events. It reveals crowd engagement faster than any oscillator. When Relative Volume later dropped back to 1.2, traders knew momentum had faded—an ideal exit confirmation.
In event-driven trading, this timing advantage can make the difference between profit and loss.
Common Mistakes When Using the Relative Volume Indicator
Despite its simplicity, misuse of the Relative Volume Indicator is common. Traders often misread spikes or ignore broader context.
Avoid these pitfalls:
- Ignoring Market Context: A high reading during news events might reflect temporary noise. Always verify the reason behind the surge.
- Overreliance on Volume Alone: Combine relative volume with price structure to confirm direction.
- Neglecting Multi-Timeframe Analysis: One-minute spikes may not matter on daily charts.
- Skipping Backtesting: Always test your Relative Volume strategy before applying it live.
Understanding these mistakes refines your accuracy. Consistent practice with contextual awareness ensures the indicator becomes a trusted part of your analysis toolkit.
Combining Relative Volume with Other Technical Tools
No single indicator should guide all decisions. Pairing the Relative Volume Indicator with other tools enhances its effectiveness.
- Moving Averages: Confirm that rising relative volume aligns with trend continuation.
- RSI: Use Relative Volume spikes near overbought or oversold zones for timing entries.
- MACD: Combine crossovers with increased relative volume for strong confirmations.
For instance, when RSI breaks above 50 and relative volume exceeds 2.0, traders receive a dual validation signal. Conversely, when price approaches resistance with declining relative volume, it hints at weakening demand. These combinations make volume-based trading signals more reliable and actionable in real time.
Best Practices for Long-Term Trading Success
Sustained success with the Relative Volume Indicator requires discipline and consistency. Follow these best practices:
- Track relative volume trends weekly to spot participation shifts early.
- Compare current readings to historical benchmarks for context.
- Document trade results to understand which signals worked best.
- Use alerts to capture sudden surges without watching charts constantly.
- Blend volume insights with risk management rules to control exposure.
These habits convert volume observation into a repeatable process. Over time, you’ll notice patterns—how volume builds before major market events or fades before reversals. Such awareness creates confident, data-driven trading decisions.

Conclusion
The Relative Volume Indicator stands out as a simple yet powerful tool for traders seeking better timing and confirmation. It reveals where true participation lies and whether a move is likely to be sustained. By understanding how to use relative volume in trading, you gain a clearer view of crowd behavior and market conviction.
A disciplined Relative Volume strategy turns raw volume data into actionable insights. Combining trading volume analysis and volume-based trading signals ensures you trade alongside strength, not noise. Whether used in forex, stocks, or crypto, it provides a measurable edge for identifying genuine opportunities.
In 2025’s algorithmic landscape, traders who integrate participation analysis into their process will consistently outperform. The Relative Volume Indicator makes that possible—helping you trade smarter, enter earlier, and time the market with precision.
Read here to learn more about “Forex Trading Robots: Easy Strategy That Actually Works in 2025“

I’m Chaitali Sethi, a financial writer and market strategist focused on Forex trading, market behaviour, and trader psychology. I simplify complex market movements into clear, practical insights that help traders make better decisions and build a stronger trading mindset.