

Spotting the right chart pattern at the right time is one of the most powerful skills a trader can develop. Among the many patterns available, the triangle chart pattern stands out for its reliability and clear signals in trend trading. This price consolidation pattern forms when the market enters a phase of indecision, with buyers and sellers pushing price into a tightening range. The result is a visually distinct triangle shape that appears time and again on forex, stock, and crypto charts.
What makes the triangle chart pattern so valuable is how often it leads to breakout trading opportunities. Whether you’re watching for an ascending triangle pattern signalling bullish momentum or a descending triangle pattern pointing to downside risk, this setup helps traders prepare for the next big move. By understanding how triangle chart patterns work and learning to trade their breakouts, you can put yourself in the best position to catch trends early and trade with confidence.
Why Every Trader Needs the Triangle Chart Pattern
Trading success is not about guessing where the market goes next. It is about recognising recurring price consolidation patterns and acting with discipline when the odds are in your favour. The triangle chart pattern is popular because it distils market indecision into a simple, actionable setup. When price squeezes between converging trendlines, a battle rages between buyers and sellers. Eventually, a breakout trading move erupts, and the market quickly trends in a clear direction.
Whether you are day trading short-term charts or swing trading longer trends, the triangle chart pattern gives you a reliable signal for price consolidation turning into trend continuation or reversal. The pattern works on all timeframes, from five-minute scalps to weekly trend moves. Its repeatability, clarity, and strong breakout trading results are why professional traders always keep an eye out for triangle chart patterns.

Anatomy and Psychology of the Triangle Chart Pattern
The triangle chart pattern forms when the price consolidates between two converging trendlines. One line acts as support, the other as resistance. The space between these lines narrows over time, reflecting how both buyers and sellers are becoming more hesitant and are waiting for a breakout. This period of tightening price action is the classic price consolidation pattern that precedes major market moves.
Psychologically, the triangle chart pattern is a visual story of uncertainty and anticipation. As price bounces between the trendlines, traders who lack conviction gradually exit their positions. Volume often dries up as the range narrows, showing that big players are waiting for confirmation before jumping in. The triangle chart pattern’s true power is released when price finally breaks out of this price consolidation pattern. The resulting breakout trading move can be fast and dramatic as traders rush to enter and those on the wrong side exit in panic.
The Three Triangle Chart Pattern Types in Focus
There are three main types of triangle chart patterns: ascending triangle pattern, descending triangle pattern, and symmetrical triangle pattern. Each reflects a different type of market psychology and has its own breakout trading tendencies.
Ascending Triangle Pattern
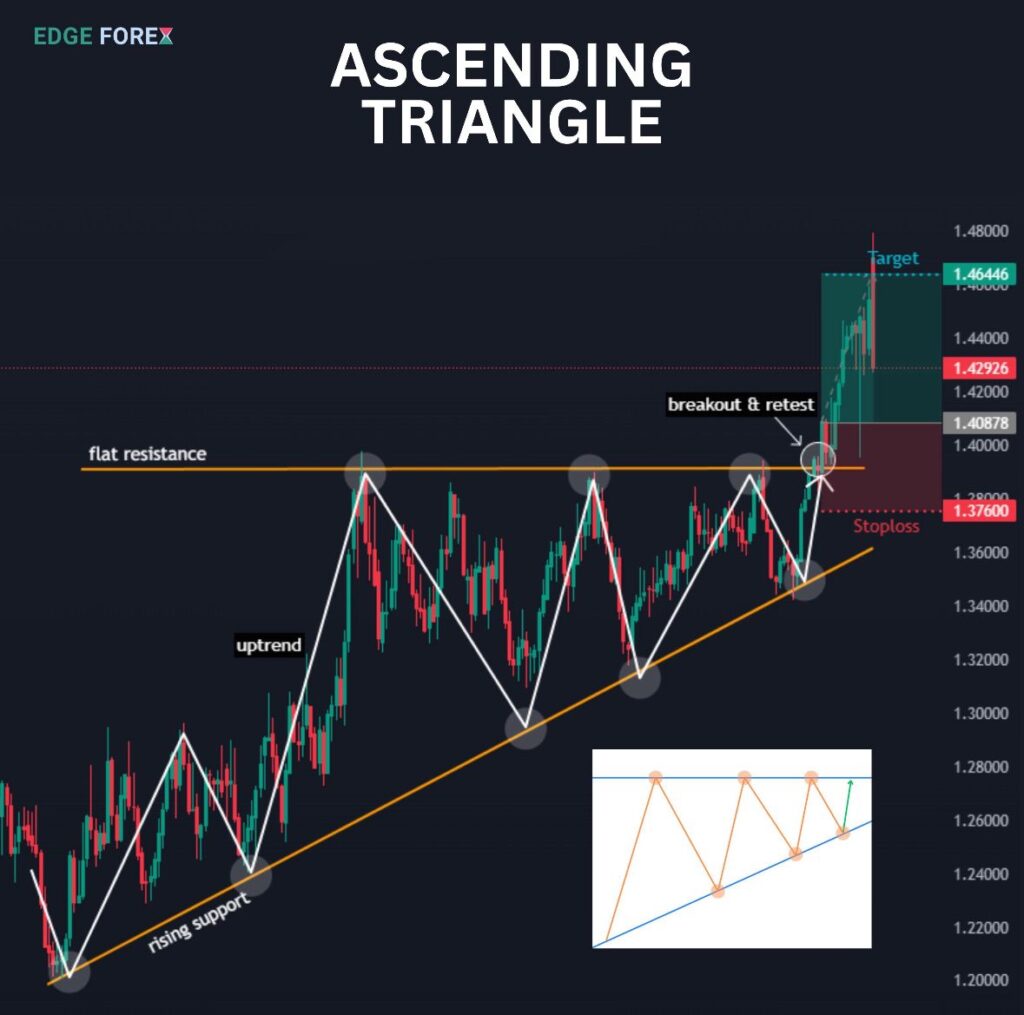
The ascending triangle pattern is the textbook bullish price consolidation pattern. You will see a flat resistance line on top and a rising support line below. This setup means buyers are getting stronger with each price pullback, pushing the lows higher every time, while sellers stubbornly defend the same resistance level. The price “squeezes” upward until, finally, a burst of bullish energy breaks through resistance.
For example, let’s say EURUSD rallies to 1.1000 but fails to break above. Each time it pulls back, support appears at higher levels—first at 1.0950, then 1.0975, then 1.0990. The ascending triangle pattern is forming. Once the price finally closes above 1.1000, especially on a surge in volume, breakout trading strategies trigger long entries. The most common price target is calculated by adding the triangle’s height to the breakout level.
The psychology of the ascending triangle pattern is about persistent buying pressure. Sellers hold the line until their resolve breaks. This is why the ascending triangle pattern is a favourite among traders searching for clear, confident breakouts after periods of price consolidation.
Descending Triangle Pattern
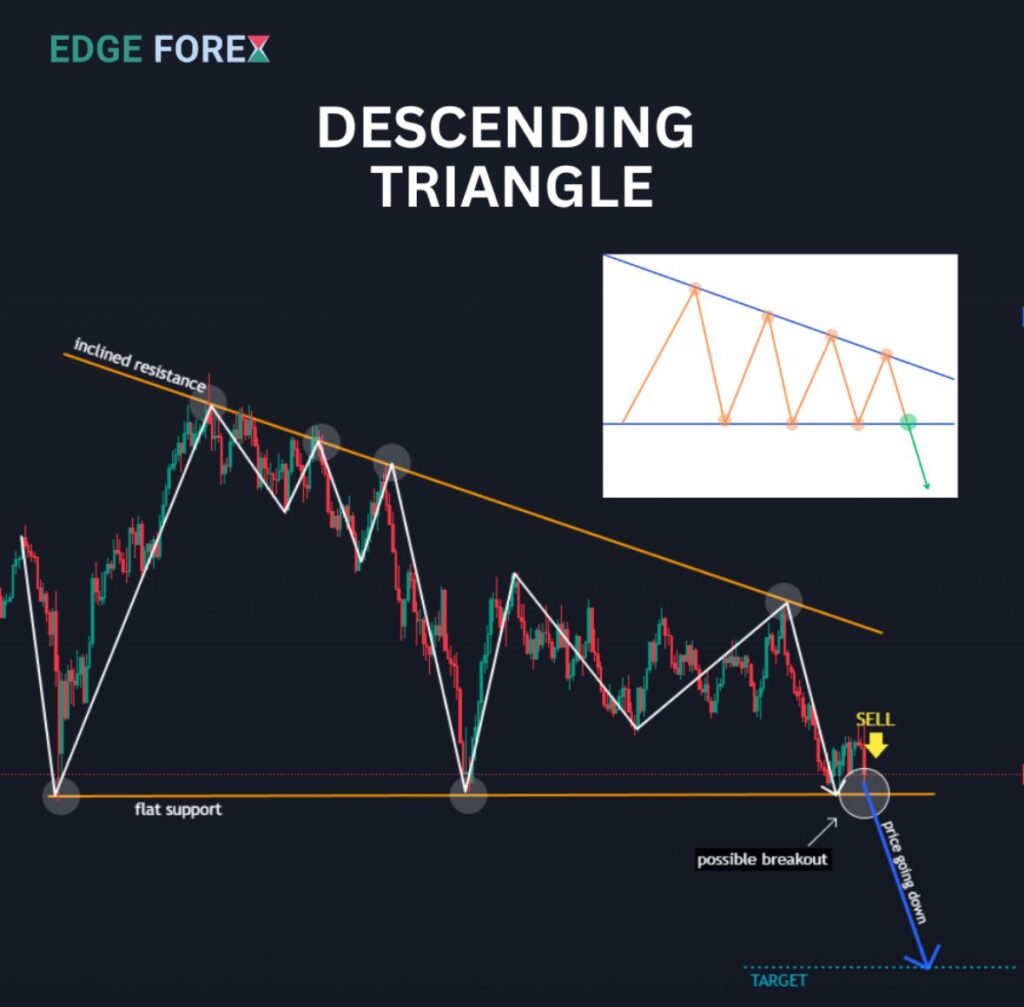
The descending triangle pattern is the opposite: a bearish price consolidation pattern. It appears as a flat support line on the bottom and a downward-sloping resistance line above. Here, sellers become increasingly aggressive, pushing each high lower, while buyers manage to hold the same support—at least for a while.
Take GBPUSD as an example. Price bounces off 1.2500 multiple times, but each rally fails at a lower high, such as 1.2550, then 1.2530, then 1.2515. The descending triangle pattern is forming. When price finally breaks below 1.2500 with high volume, sellers gain the upper hand, and breakout trading strategies target new lows by subtracting the triangle’s height from the breakdown point.
The psychology is straightforward. Sellers dominate each rally, and buyers lose conviction. The support eventually collapses, setting off a cascade of selling as stop orders trigger and traders scramble to exit losing positions.
Symmetrical Triangle Pattern
The symmetrical triangle pattern is the most balanced and neutral of the three. Both trendlines slope toward each other, forming a classic wedge. Neither buyers nor sellers have a clear advantage. Price swings become smaller, coiling the market like a spring. When the breakout happens, it can go either way, and the move is often sharp.
Symmetrical triangle patterns are common before major news events or earnings or after volatile moves when the market needs to “cool off” and decide its next direction. Volume drops as the pattern forms, then surges during the breakout. The measured target is usually the triangle’s height, projected in the breakout direction.
How to Spot and Draw the Triangle Chart Pattern
Spotting a valid triangle chart pattern requires a trained eye and patience. The pattern should have at least two touches on each trendline, and the price should clearly contract toward the apex. A proper triangle chart pattern should not look like random zigzags; the trendlines must be obvious and meaningful.
Start by drawing support and resistance lines along the swing lows and highs. The triangle is valid only when these lines converge, forming a clear price consolidation pattern. Avoid trading triangles that are too short in duration or lack volume contraction. The best setups occur after the pattern matures, usually near two-thirds to three-quarters of the way to the triangle’s apex.
Volume is your confirmation. It should decline as the triangle forms, then surge as the breakout occurs. If you see a breakout with low volume, be cautious—this can signal a false move.

Breakout Trading With Triangle Chart Patterns
Breakout trading is the heart of the triangle chart pattern strategy. The period of price consolidation builds up tension, and the release of that energy at the breakout is where the big money is made. Whether trading the ascending triangle pattern or descending triangle pattern, the goal is to enter after confirmation and ride the move as far as possible.
For the ascending triangle pattern, enter long when the price closes above resistance with a spike in volume. For the descending triangle pattern, go short when the price closes below support on strong volume. Symmetrical triangles require more caution—use pending buy and sell stop orders above and below the pattern to catch the move in either direction.
Your stop-loss goes just outside the triangle’s opposite side. Targets are usually the triangle’s height projected from the breakout. Some traders prefer to take partial profits at the target and trail a stop for more upside.
For example, suppose Apple forms an ascending triangle pattern ahead of earnings, with resistance at $200 and rising lows. If earnings beat expectations and the price surges above $200, a well-placed breakout trading entry can capture a fast rally. The same logic applies to forex and crypto.
The Power of Price Consolidation Patterns in All Markets
The triangle chart pattern is universal. In forex, these price consolidation patterns often appear before economic news, creating fast breakout trading opportunities on pairs like EURUSD or USDJPY. In stocks, triangle chart patterns frequently form before earnings or news releases, giving prepared traders a road map for potential moves. In crypto, the non-stop action and volatility mean triangle chart patterns develop and resolve frequently—Bitcoin, for example, has delivered some of its biggest moves from these setups.
Triangle chart patterns also appear on all timeframes. Day traders use them for fast scalp trades on five-minute charts, while swing traders spot them on daily or weekly charts for longer, more powerful moves. The versatility and clarity of the triangle chart pattern make it a critical tool for all types of traders.
Example-Driven Understanding:
Let’s explore a few recent market examples for greater clarity.
- In 2023, the S&P 500 index formed a large symmetrical triangle pattern from January to April. As the range narrowed, traders anticipated a big move. When the price broke above the upper trendline, a major breakout trading rally followed, with volume confirming the move.
- In forex, USDJPY consolidated for weeks in an ascending triangle pattern, with resistance near 150.00. After multiple higher lows and repeated tests of resistance, the pair broke out, surging more than 300 pips in two days.
- In crypto, Ethereum formed a descending triangle pattern after an extended bull run. Support at $1800 held for several attempts, but each rally failed at lower highs. When the pattern resolved with a breakdown, ETH dropped rapidly to $1600, giving breakout traders a clean and profitable short.
These real-world examples show how the triangle chart pattern, in its different forms, creates opportunities in all major markets.
Avoiding Common Mistakes With Triangle Chart Patterns
Despite its simplicity, trading the triangle chart pattern is not without risks. Many traders fall into the trap of anticipating the breakout too soon, only to be caught in choppy, range-bound action. Always let the pattern mature and confirm the breakout with strong volume before entering.
Another mistake is ignoring the broader market context. If a triangle chart pattern forms during a dull, sideways market with no news, breakouts are less likely to stick. The odds are higher when the pattern aligns with an existing trend or precedes a major event.
Don’t overlook false breakouts. Price can break a trendline and quickly snap back, trapping breakout traders. To reduce risk, wait for a candle close outside the pattern and look for retests—if the price breaks out, then returns to the triangle’s edge and holds, that is a strong sign the move will continue.
Setting targets that are too ambitious is also common. While it’s tempting to expect massive runs, use the triangle’s height as a realistic initial target and let trailing stops capture additional gains if the trend is strong.
Advanced Tactics and Combining Triangle Chart Patterns With Other Tools
To further improve your breakout trading results, combine the triangle chart pattern with momentum indicators. The Relative Strength Index (RSI) or Moving Average Convergence Divergence (MACD) can help confirm when momentum supports the breakout. Divergence between price and indicators may warn you if a breakout is weak.
Multiple timeframe analysis also boosts success. A triangle chart pattern on a four-hour chart that aligns with an uptrend on the daily chart is much more likely to resolve in your favour.
Some advanced traders look for clusters of triangles across correlated assets or sectors. For instance, if several tech stocks form ascending triangle patterns at the same time, a breakout in one can lead to similar moves in others.
Keep a journal of all your triangle chart pattern trades. Record the market, pattern type, breakout direction, volume, entry, stop, target, and outcome. Reviewing this data reveals patterns in your success and helps you refine your approach over time.
The Pros and Cons of the Triangle Chart Pattern
The triangle chart pattern has many advantages. It is easy to spot, repeatable, and works in all markets and timeframes. It gives precise entry, stop, and target levels, making risk management simple. The pattern’s clear structure means you are less likely to act on impulse or emotion.
However, the triangle chart pattern is not infallible. False breakouts and failed moves do happen, especially in slow or indecisive markets. Patience and discipline are required to wait for confirmation and manage trades carefully. Not every triangle is worth trading; quality is more important than quantity.

Conclusion:
The triangle chart pattern is more than just a technical setup; it is a window into the market’s mood and a blueprint for breakout trading. Whether you favour the ascending triangle pattern for bullish trends, the descending triangle pattern for bearish reversals, or the symmetrical triangle for balanced indecision, mastering these price consolidation patterns will make you a better, more consistent trader.
Commit to spotting quality triangles, let patterns mature, confirm with volume, and always protect your capital with logical stops. Use real-world examples to build your understanding and confidence. Over time, the triangle chart pattern can become your edge for clear wins in trend trading, whatever the market or timeframe.
Keep studying, keep practicing, and let each triangle chart pattern you find be the start of your next breakout trading success.
Read here to learn more about “Symmetrical Triangle Pattern: Reliable Signals for Traders“.

I’m Chaitali Sethi, a financial writer and market strategist focused on Forex trading, market behaviour, and trader psychology. I simplify complex market movements into clear, practical insights that help traders make better decisions and build a stronger trading mindset.