

Introduction to MACD Divergence Chart Patterns
In 2025, traders continue to depend on MACD Divergence Chart Patterns because they provide both structure and momentum confirmation in volatile markets. Chart patterns alone often signal potential turning points, but without confirmation, they can mislead traders. By pairing them with divergence on the Moving Average Convergence Divergence (MACD) indicator, setups become more trustworthy.
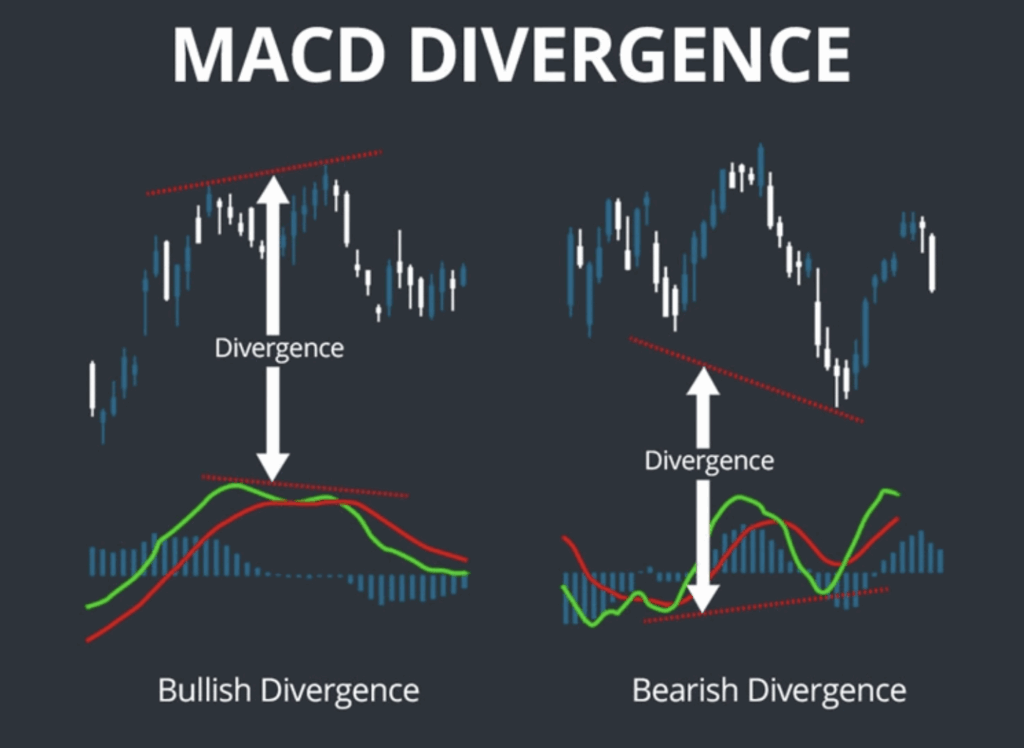
MACD divergence happens when price and momentum move in opposite directions. If price keeps rising while MACD shows weakness, it warns of a bearish reversal. If price continues falling but MACD signals strength, a bullish reversal may be near. The best chart patterns for trading, such as triangles or wedges, gain credibility when divergence supports the move.
Reversal patterns in Forex are especially powerful with this method. Technical analysis with MACD adds a second layer of confirmation. For traders learning how to use MACD divergence, the rule is patience: wait for both the chart and the indicator to align before acting.

What is MACD Divergence in Trading?
To understand MACD Divergence Chart Patterns, it helps to first define divergence. MACD, short for Moving Average Convergence Divergence tracks the relationship between moving averages to measure momentum. Its histogram and signal line reveal whether strength supports the trend. Divergence occurs when price action and momentum disagree.
- Bullish divergence: Price makes lower lows, but MACD prints higher lows. This suggests buyers are building pressure.
- Bearish divergence: Price makes higher highs, but MACD shows lower highs. This warns that bullish energy is fading.
This early signal is what makes divergence so valuable. Many traders rely on Best Chart Patterns for Trading but struggle with timing. Divergence improves accuracy by showing when momentum supports or rejects the price structure.
Reversal patterns in Forex, such as double bottoms or head and shoulders, become far more reliable with divergence. Technical analysis with MACD turns them into powerful trading tools. Learning How to Use MACD Divergence means combining these signals instead of treating them separately.
Why MACD Divergence Matters in 2025
Trading in 2025 is shaped by speed. High-frequency trading, algorithmic systems, and global volatility create conditions where false breakouts are common. MACD divergence chart patterns protect traders by filtering out weak setups.
A bullish flag, for example, might appear attractive, but if MACD shows bearish divergence, the breakout is likely to fail. Technical analysis with MACD provides clarity in such moments. The best chart patterns for trading need momentum support to work, and divergence shows whether that support exists.
In forex, quick reactions to central bank policies create unpredictable moves. Reversal patterns in Forex are more accurate when divergence confirms them. Without this extra layer, traders risk chasing trends that are already exhausted.
How to Use MACD Divergence in 2025 is about confirmation. Instead of rushing into every breakout or reversal, traders wait for the signal to align with chart patterns. By doing so, they avoid unnecessary losses and focus on trades with genuine strength.
How to Use MACD Divergence with Chart Patterns
MACD divergence chart patterns work best when applied with discipline and structure. Traders who rely on divergence alone often misinterpret signals and enter too early. The true value of divergence lies in its ability to confirm a chart formation, not replace it. When paired with patterns such as wedges, triangles, or double tops, MACD provides the momentum filter that separates strong setups from weak ones.
A structured workflow makes this process effective:
- Spot the pattern: Look for formations like wedges, triangles, or head and shoulders developing on the chart.
- Check the indicator: Compare price highs and lows with the MACD line, signal line, or histogram.
- Identify divergence: Bullish divergence forms when price makes lower lows but MACD prints higher lows. Bearish divergence forms when price makes higher highs but MACD makes lower highs.
- Wait for price confirmation: Do not act until the breakout occurs — whether it is a neckline breach, a wedge completion, or a triangle breakout.
- Control risk: Enter the trade only after confirmation, and always protect the position with a stop-loss beyond recent highs or lows.
Best Chart Patterns for Trading gain much higher accuracy when supported by momentum analysis. Technical Analysis with MACD makes the approach systematic rather than emotional, which is why professional traders rely on it in fast-moving markets.
For traders still learning How to Use MACD Divergence effectively, the key lesson is patience. Divergence is not a guarantee; it is a filter that removes low-quality trades. By combining divergence with chart structures and solid risk management, setups become more consistent. Reversal Patterns in Forex, in particular, succeed far more often when this disciplined method is followed.

Understanding Chart Patterns with MACD Divergence
Before diving into the specific types, it is important to understand why chart patterns matter. Chart patterns reflect market psychology at key levels. They show how buyers and sellers react around support and resistance. On their own, they offer direction. When combined with divergence, they provide confirmation.
MACD divergence chart patterns highlight momentum behind these structures. The best chart patterns for trading, like triangles or head and shoulders, may suggest a breakout, but divergence shows whether momentum supports it. Technical analysis with MACD ensures that traders avoid weak setups.
Reversal patterns in Forex, such as double bottoms or triple tops, become far more trustworthy with divergence confirmation. For those asking how to use MACD divergence, the key is to treat it as validation. Traders who use this method enter only when price and momentum align.
With this foundation in place, let’s explore the main types of MACD divergence chart patterns traders trust in 2025.
Double Top and Double Bottom Patterns
Double tops and double bottoms are classic MACD divergence chart patterns that remain highly respected in technical trading. They represent repeated tests of key resistance or support levels, showing whether buyers or sellers can maintain control. When confirmed by MACD divergence, these patterns become powerful reversal signals across forex, stocks, and commodities.
A double top forms when price tests a resistance zone twice but fails to break higher. The first peak often reflects strong buying, but the second peak shows hesitation. If MACD prints lower highs during the second test, bearish divergence confirms weakening momentum. This is a warning that the uptrend is fading, and a reversal downward is likely once support is broken.
A double bottom signals the opposite. Price touches support twice, creating the impression of weakness. Yet, if MACD forms higher lows on the second test, bullish divergence reveals hidden strength. Buyers are quietly stepping in, and once resistance above the pattern breaks, an upward reversal often follows.
Practical Trading Insights
- Confirm with divergence: Don’t trade after the first test. Wait until the second test and check MACD for confirmation.
- Watch volume: Falling volume on the second top or rising volume on the second bottom adds reliability.
- Wait for breakout: The pattern is only valid once the neckline or resistance/support breaks.
- Use stops carefully: Place stop-losses just beyond the second peak or trough to reduce risk.
- Focus on higher timeframes: Double formations on daily or weekly charts carry stronger signals.
For instance, EURUSD once formed a double bottom at a key support zone. Price showed equal lows, but MACD revealed a higher low, signalling accumulation. Soon after, the pair rallied, proving how technical analysis with MACD can transform familiar structures into high-probability trades.
Head and Shoulders and Inverse Head and Shoulders
The head and shoulders formation is one of the most recognised MACD divergence chart patterns because it highlights the moment when a trend begins to weaken. Traders often rely on this pattern at major tops or bottoms to spot high-probability reversals, especially when divergence supports the setup.
A head and shoulders at market highs forms with three peaks. The middle peak (the head) is higher than the shoulders on either side. On its own, it suggests buyer fatigue, but when MACD shows lower highs during the right shoulder, bearish divergence confirms the loss of momentum. Once the neckline breaks, selling pressure usually accelerates.
The inverse head and shoulders appears at market lows with three troughs. The central trough is the lowest, but if MACD creates higher lows during the right shoulder, bullish divergence indicates that sellers are weakening. A confirmed neckline breakout often sparks a powerful rally.
Key Insights for Traders
- Watch the right shoulder: This is where MACD divergence usually appears, providing the clearest warning of reversal.
- Confirm with the neckline: The pattern only completes when the price breaks the neckline with momentum.
- Use higher timeframes: Daily and weekly charts offer stronger reliability than short intraday setups.
- Combine with volume: Falling volume on the right shoulder strengthens the divergence signal.
- Apply risk management: Stops should be placed beyond the right shoulder to avoid whipsaws.
A strong example occurred in GBPJPY, where an inverse head and shoulders aligned with bullish MACD divergence. The breakout led to a sharp rally, showing how technical analysis with MACD adds conviction. The best chart patterns for trading like this succeed more often when traders combine structure with momentum confirmation.
Triangles and Breakout Patterns
Triangles are among the most common MACD divergence chart patterns, appearing in markets when price consolidates before making its next move. They represent a battle between buyers and sellers, and while traders often expect strong breakouts, momentum confirmation from MACD is what separates reliable setups from false ones.
There are three main types of triangles, and each reacts differently to divergence.
Ascending Triangle
- Price makes higher lows against a flat resistance level.
- Normally bullish, but if MACD shows lower highs, bearish divergence signals weakness.
- In such cases, the breakout upward often fails or reverses.
Descending Triangle
- Price forms lower highs while testing horizontal support.
- Usually bearish, but if MACD shows higher lows, bullish divergence suggests selling pressure is fading.
- A reversal upward can occur instead of a continuation downward.
Symmetrical Triangle
- Price compresses into converging support and resistance.
- Neutral by nature, but divergence can indicate the stronger side before the breakout.
- Traders who check MACD often spot the true direction earlier.
Market Example
The USDJPY pair frequently forms symmetrical triangles. Traders who acted only on price often fell into false breakouts. Those who combined technical analysis with MACD filtered weak signals and waited for valid setups, improving accuracy.
Key Takeaway
Best chart patterns for trading, like triangles, are effective only when supported by momentum. Reversal patterns in Forex often emerge from failed triangles where divergence contradicted the expected breakout. How to Use MACD Divergence here is straightforward: confirm that momentum agrees with the breakout direction before entering. Patience and confirmation are what turn triangles from traps into profitable opportunities.
Wedges as Key Divergence Patterns
Wedges are among the most effective MACD divergence chart patterns because they capture both market psychology and momentum. These structures show a trend of losing strength over time. When paired with divergence, they often provide early warnings of significant reversals in forex, stocks, or commodities.
Rising Wedges and Bearish Divergence
A rising wedge typically forms during an uptrend. Price continues to create higher highs and higher lows, but the slope narrows, signalling buyer fatigue. Traders often misinterpret this as a continuation pattern, but in reality, it reflects slowing demand. When MACD shows lower highs while price moves upward, bearish divergence confirms the weakness. Once the wedge breaks downward, the reversal tends to be swift, with trapped buyers rushing to exit.
Falling Wedges and Bullish Divergence
A falling wedge develops during a downtrend. Price forms lower lows and lower highs, but the range tightens, showing that sellers are losing control. This structure alone hints at a reversal, but MACD adds confirmation. If the indicator prints higher lows while the price falls, bullish divergence signals that buyers are preparing to take over. When the wedge breaks upward, the move often surprises traders who expected further downside.
Real Market Examples
AUDUSD has shown several rising wedges in long rallies. In one case, while price pushed to new highs, MACD consistently made lower peaks. When the wedge broke down, the pair reversed sharply. Similar behaviour is seen in equities like tech stocks, where falling wedges have triggered powerful rebounds after prolonged declines.
Trading the Wedge with MACD Divergence
Best Chart Patterns for Trading like wedges demands patience. Traders should never assume a breakout will succeed without checking momentum. Technical analysis with MACD ensures confirmation. How to Use MACD Divergence Effectively is simple: wait for the breakout direction, confirm alignment with MACD, and then enter with stops beyond recent highs or lows. This structured method transforms wedges into high-probability trading opportunities.
Flags and Pennants with Divergence
Flags and pennants are often recognised as continuation formations that appear after sharp moves, but when studied as MACD divergence chart patterns, they frequently highlight hidden weakness that many traders overlook. On the surface, these compact structures suggest that the market is simply pausing before continuing in the same direction. However, when momentum measured by MACD contradicts the price action, the probability of failure rises sharply.
A bullish flag usually forms after a strong rally, where the price retraces slightly in a downward-sloping channel. Most traders expect the uptrend to resume once the consolidation ends. Yet, if MACD begins to show lower highs while price is preparing for a breakout, bearish divergence indicates fading momentum. Instead of continuation, the market may stall or reverse, trapping traders who entered too aggressively.
A bearish pennant often forms after a steep decline, with price compressing inside a small triangular shape. While it appears to signal continuation downward, bullish divergence on MACD—where the indicator prints higher lows—reveals that sellers are losing strength. In such cases, what begins as a continuation setup may transform into a reversal, forcing traders to rethink their strategy.
Cryptocurrencies, especially Bitcoin, offer clear examples of this phenomenon. During rallies, bullish flags formed repeatedly, yet MACD divergence exposed weak buying pressure. Many of these breakouts failed, but traders who used technical analysis with MACD avoided unnecessary losses by staying patient.
The best chart patterns for trading, such as flags and pennants, are most effective when confirmed by momentum. Reversal patterns in Forex also emerge when these setups collapse under divergence pressure. The safest approach for traders learning how to use MACD Divergence is simple: never assume a breakout will succeed without checking if momentum supports it.
Triple Tops and Triple Bottoms
Triple tops and triple bottoms are not as common as double formations, but when they align with divergence, they become some of the most dependable MACD Divergence Chart Patterns. These structures show repeated battles at important levels, where market psychology plays out clearly between buyers and sellers. Because they take time to develop, they often appear on higher timeframes, giving them stronger reliability.
Understanding Triple Tops with Bearish Divergence
A triple top occurs when price tests the same resistance level three times but fails to break higher. Each attempt reflects weaker buying pressure. If MACD simultaneously produces lower highs, bearish divergence confirms that momentum is declining. This combination warns traders that the trend is exhausted and a reversal downward is likely. Often, volume also decreases with each peak, providing extra confirmation that bulls are losing control.
Recognising Triple Bottoms with Bullish Divergence
A triple bottom shows the opposite psychology. Price tests support three times, but each attempt to break lower is rejected. If MACD forms higher lows while price stays flat, bullish divergence indicates growing buyer strength. Once the pattern completes with a breakout above resistance, the move upward is usually strong and decisive.
Market Examples and Practical Use
Gold frequently displays triple bottoms near historical support zones. In several cases, while price held flat, MACD showed rising momentum. Once the breakout occurred, rallies followed with speed. In forex, EURUSD and GBPUSD have also formed triple tops at key resistance areas, where MACD divergence warned of trend exhaustion.
Trading Approach
Reversal patterns in forex and commodities using these setups require patience. Best Chart Patterns for Trading like triples takes longer to confirm, so traders must avoid early entries. How to use MACD Divergence effectively here is straightforward:Wait for the third test, confirm divergence on MACD, and act only after a clear breakout in the expected direction. This structured approach reduces false signals and increases accuracy.
Practical Steps for Traders
MACD Divergence Chart Patterns are only as effective as the discipline with which they are applied. Many traders recognise divergence on charts but fail to use it consistently or combine it properly with patterns. To make the most of these signals in 2025, traders must follow a structured approach that balances confirmation, patience, and risk control.
Key Steps for Applying Divergence
- Use higher timeframes for stronger signals
Short-term divergence often produces noise. Focusing on four-hour or daily charts provides cleaner setups. This makes MACD Divergence Chart Patterns more reliable across forex, stocks, and crypto. - Wait for both chart and divergence confirmation
Entering too early reduces success. The best chart patterns for trading, such as wedges or double tops, become more accurate when the divergence is fully formed. Technical analysis with MACD requires patience and observation. - Always place stop-losses beyond recent highs or lows
Even perfect reversal patterns in Forex can fail. Protecting trades with stop-loss orders ensures losses stay manageable if the market moves unexpectedly. - Avoid overtrading every divergence
Not every divergence matters. Many minor shifts appear during sideways markets. Traders must focus only on setups where the chart pattern is clear and confirmed by MACD. - Keep risk management above all
How to Use MACD Divergence effectively is not only about identifying the setup. Position sizing, account management, and emotional discipline are just as important for long-term consistency.
Why Discipline Matters
Technical analysis with MACD is a filter, not a guarantee. Traders who respect the process enter fewer trades but achieve higher accuracy. The best chart patterns for trading succeed more when paired with divergence, and reversal patterns in Forex gain extra strength. In the end, discipline in using divergence is the real edge that separates professionals from beginners.

Conclusion
In 2025, MACD Divergence Chart Patterns remain one of the most reliable tools for traders. Double tops, double bottoms, head and shoulders, wedges, triangles, flags, pennants, and triple formations all become more accurate when confirmed with divergence.
The best chart patterns for trading provide structure. Technical analysis with MACD adds momentum. Reversal patterns in Forex gain credibility when both align. For traders learning how to use MACD divergence, the message is clear: treat divergence as confirmation, not prediction.
By combining price structure with momentum, traders avoid false signals and increase consistency. In fast-moving markets, MACD Divergence Chart Patterns remain essential for sustainable trading success.
Read here to learn more about “Pullback Trading vs. Trend Reversals: Smart Choices in 2025“

I’m Chaitali Sethi, a financial writer and market strategist focused on Forex trading, market behaviour, and trader psychology. I simplify complex market movements into clear, practical insights that help traders make better decisions and build a stronger trading mindset.